CHARLES RIVER WATERSHED ASSOCIATION
CHARLES RIVER WATERSHED ASSOCIATION. Measurement, Innovation and Environmental Protection: Getting to Flow-Trading on the Charles. WATERSHEDS OF MASSACHUSETTS. Charles River Watershed 27 Major River Basins in State. THE CHARLES RIVER WATERSHED. Charles River Watershed. 308 SQ. MILES

CHARLES RIVER WATERSHED ASSOCIATION
E N D
Presentation Transcript
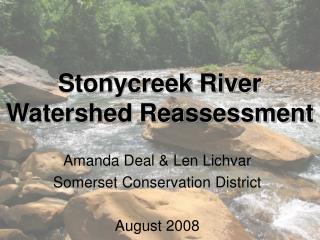
CHARLES RIVER WATERSHED ASSOCIATION Measurement, Innovation and Environmental Protection: Getting to Flow-Trading on the Charles
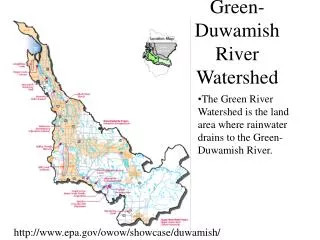
WATERSHEDS OF MASSACHUSETTS Charles River Watershed 27 Major River Basins in State
THE CHARLES RIVER WATERSHED Charles River Watershed 308 SQ. MILES POP. 900,000 80 MILES LONG 23,000 ACRES WETLANDS
Flow Base flows Precip PanE PET ET Flow Chk CFS 2510 1455 CFSM 1.7 1.0 Inches/Year 23.5 13.6 58 60 51 33.15 24.88 Groundwater Base flow % 58% Atlanta Estimated Annual Water Budget
Baseflow and Average Annual Flow Atlanta, GA
THE PROBLEM WE FOUND • Standard Municipal Engineering • Rainwater treated as a liability • Impervious surfaces/accelerated runoff • Seasonal Demand & Instream Flow
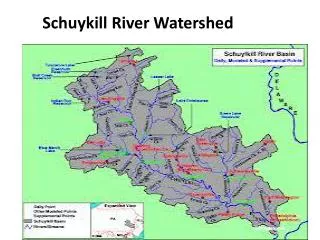
U P P E R C H A R L E S G R O U N D W A T E R S T U D Y S t u d y A r e a N C h a r l e s R i v e r M A T o w n s 5 0 0 5 0 M i l e s
D N A L H S A M I N E B R O O K D O P P I N G 6 1 B # R $ O J A $ $ O 1 R K 2 B R 6 O S H E R B O R N # O r K C H 8 I C 5 r K # N E r N H O P K I N T O N B R H O L L I S T O N $ O # B O E r K A B V $ O E R G # A $ B S R T O r O O # K W B R $ O $ # # O K 4 9 M I L L I S 5 # # M E D W A Y r H $ O 1 $ $ P 1 P # I 5 $ N 1 9 0 $ 1 G $ 2 2 0 2 M i l e s B 6 r R O $ O # # K S T r # r A L r M I L F O R D $ L r $ B # r R # $ $ O # # # r $ # # # O R $ # K $ E # S V H # I E r R $ $ r P # # r # L A R L # r I H D $ r M S N O R F O L K O # 1 B P R 4 # # E $ # # $ O # # $ E W i t h d r a w a l s 0 B D O A E K A G # A # L L V E E E F R A N K L # B F l o w G a u g e s R r # r # R $ $ B O R O M # r $ O # # K r # # E O # W a t e r L e v e l s # K r # N # D 0 # 4 # 1 O T r i b u t a r i e s r B E L L I N G H A M N r U N C A S B R C h a r l e s R i v e r O # O K $ $ # $ $ $ r # K # O L a k e s & P o n d s 4 O R 9 B 5 # E N $ A I M S t u d y A r e a 1 $ $ # # W R E N T H A M r D I L i m i t e d A c c e s s H i g h w a y X M I B 1 # S 2 R 1 C O O M a j o r R o a d - C o n n e c t o r O $ E K # B R O $ M i n o r S t r e e t o r R o a d O K 6 0 6 M i l e s I N
PREDICTED FLOWS FROM MINE BROOK 40 35 30 25 20 Flow (cfs) 15 10 5 0 0 2 4 6 8 10 12 Month Proposed pumping Existing Recharge=3.4 in/yr
ECONOMIC SCREENING ANALYSIS • Methodology • Compare cost of BMPs necessary to achieve specific flow increases to potential savings at POTWs in upper basin • BMP costs: • Identify effective mix of BMPs • Estimate annual cost per acre served • Estimate extent of application needed to achieve target river flow increase
ECONOMIC SCREENING ANALYSIS • Methodology (continued) • POTW savings: • Research TMDL development and likely trends in phosphorus effluent limitations • Estimate potential savings realized if flow increases preclude need for advanced phosphorus treatment • Analyze how costs and savings compare at range of target flow levels
ECONOMIC SCREENING ANALYSIS • Key Parameters/Issues • Future phosphorus effluent limits and associated treatment plant changes • Flow increase that will preclude tightest phosphorus effluent limits (e.g., 0.02 mg/L) • Hydrological parameters to translate enhanced BMP infiltration into river flow increases • Feasible levels of BMP application in upper basin
ECONOMIC SCREENING ANALYSIS • Status • Interviewing permitting and TMDL experts to identify likely trends in phosphorus effluent limits • Reviewing literature • Phosphorus removal costs at POTWs • BMP costs and effectiveness • Developing spreadsheet model of costs and savings
THE TRADING PLAYERS • Publicly Owned Treatment Works • Water Suppliers • Residential, Commercial, Industrial Developers
OPTIMUM RESULTS • Reduced Stormwater Runoff/Pollution • Enhanced Groundwater Recharge • Enhanced Instream Flow • Improved Water Quality • Reduced Cost • Algorithm to replicate based on recharge and flow enhancement
Holliston Water Budget Net Annual Change in Aquifer= Recharge - Withdrawal + Return Precip Runoff, Evapotranspiration Impervious Runoff Recharge CRPCD Losses Well WD Septic GW Discharge
THE PROBLEMS (WE THOUGHT) • Combined Sewer Overflows • Stormwater Pollution • Low Base Instream Flow