Download
1 / 64
640 likes | 773 Vues
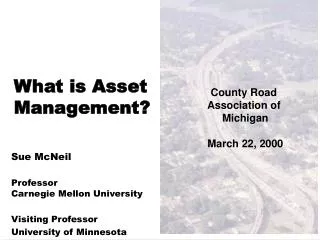
What is Asset Management?. County Road Association of Michigan March 22, 2000. Sue McNeil Professor Carnegie Mellon University Visiting Professor University of Minnesota. Questions?. How much should you spend on signs versus equipment?

E N D
What is Asset Management? County Road Association of Michigan March 22, 2000 Sue McNeil Professor Carnegie Mellon University Visiting Professor University of Minnesota
Questions? • How much should you spend on signs versus equipment? • How much should you spend on maintenance versus expansion? • What resources will you need 10 years from now?
Outline • Overview and status • Performance and asset value • Where to next?
Asset Management: A Tool for Managing Highway Assets Overview
Overview and Status • Asset management definitions/goals/attributes • Asset management components • History • Status of asset management in the US • So why do agencies need asset management? • Examples
Overview and Status Asset Management Definitions • . . . is a systematic process of maintaining, upgrading, and operating physical assets cost-effectively • . . . Combines the use of sound engineering principles, accepted business practices, and economic theory to improve the decision-making process
Goals • To provide ready access to quantitative and qualitative data • To facilitate decision-making based on data • To utilize principles drawn from economics, accounting, risk management, and customer service models • To ensure efficient resource allocation and asset optimization
Attributes Required to Realize Benefits • Common performance measures and criteria • User-friendly environment • Customer focus • Accessibility within agency • Flexibility • Link to technical, management, and budgetary processes • Exchange of information
Quantifiable Objectives • Enhance knowledge of inventory and asset value • Develop links that tie resource allocations to savings from replacement • Establish standardized processes and protocols • Consider life-cycle costing
Benefits of AMS • Improve program quality • Improve information and access to information • Facilitate economic assessment of various tradeoffs • Improve documentation of decisions • Improve information on return on investment and value of investments • Reduce short-and long-term costs
Components of an AMS • Asset inventory • Location/Asset Referencing System • A centralized database • Analysis tools • Reporting tools
Components(FHWA) Goals and Policies Asset Inventory Condition Assessment and Performance Modeling Budget/Allocations Alternatives Evaluation and Program Optimization Short and Long- Range Plans Program Implementation Performance Monitoring
Asset Inventory Analysis Modules Central Database Location/ Asset Referencing Systems Report Modules Graphics - Summaries - Map Links Framework for AMS
Asset Inventory System • Identification of assets included • Inventory of basic characteristics • Assessment of asset conditions • Estimate of asset age
Location/Asset Referencing System • Geographic location • Reference system • Identifiers for equipment
BMS Revenues Project BMS Maintenance Accounting Pavement Safety Data Congestion Budgeting Permits Contracts Equipment Materials District and Local Offices Central Database • Contains inventory information • Facilitates exchange of information
Analysis Modules • Forecast of Future Conditions • Impact Analysis of Various Scenarios
Reporting Modules • Presentation of Inventory Information • Presentation of Analysis Results • Formats: • Graphics • Tables • Maps
Asset Management versus Managing Assets • History • Survey - Status of Asset Management in the United States.
History • 1970’s - pavement management • 1980’s - bridge management • 1990’s - asset management
Recognition of common characteristics Projects/ components are parts of networks Long time horizons Presence of trade-offs Indivisibility Variability in space and time Subject to design standards Subject to deterioration Subject to uncertainty Exhibit many modes of failure Hierarchical decision process Background
1991 - ISTEA 1994- Road Asset Management Guideline - Austroads 1995 - Report on Current Practice - Australia 1996 - AASHTO/FHWA Workshop - Public Private Perspectives 1997 - AASHTO/FHWA Workshop - The Future AASHTO Task Force formed History
History • 1998 • New York State - Concept Plan • AASHTO Task Force Strategic Plan • TAC - Primer on Highway Asset Management • APWA - Asset Management for the Public Works Manager • 1999 • FHWA - Office of Asset Management formed • OECD Asset Management Systems Working group • FHWA/AASHTO Workshop (December) • FHWA Primer on Asset Management
Status of Asset Management in the United States • Survey Questions • Inventory of Assets • Investment Decisions • Workshop Agenda • Responses
Survey Responses Received responses from states in grey
Survey Responses (CONTINUED) • Number of Responses -- 33 • Points of Contact for Asset Management • none -- 12, one -- 13, more than one -- 8 • States with Inventories -- 33 • average per state -- 9 • inventories with conditions -- 66% • States with Management Systems -- 32 • average per state -- 7 • inventories with performance indicators -- 70%
Survey Responses (CONTINUED) • States Attempting Asset Valuation -- 13 • replacement cost -- 10 • historic expenditures -- 6 • equivalent value -- 5 • other -- 2 Other includes HPMS Financial Analysis package and investment/fair market basis.
Survey Responses (CONTINUED) • States Using Decision Making Tools -- 32 • cost-benefit analysis -- 29 • life-cycle costing -- 28 • trade-off analysis -- 9 • quantitative investment analysis -- 4 • other -- 9 Other includes citizen and political input, value engineering, grade crossing hazard ratings, first cost, threshold levels, and highway needs analysis.
Survey Responses (CONTINUED) • Apply tools across modes -- 7 • Analysis to allocate capital vs. maintenance -- 10 • CBA of major maintenance expenditures -- 11 • CBA for operational improvements -- 11 • Evaluate how expenditure improves system -- 17 • Relate budget expenditures to system performance -- 22 • Automatic updating of systems based on expenditures -- 13
Survey Responses -Conclusion • Many states have elements of asset management • for specific types of assets • for specific activities • Examples include • Performance based programming • Integrated maintenance management • Integrated management systems • Preservation and improvement tradeoffs
Why do agencies need asset management? • Aging infrastructure • Preservation, and good business practices provide a foundation • Customer focus means a shift in emphasis from outputs to performance • Demand for better accountability • Magnitude of the investment • Asset management is a vehicle for delivering
Premises • One size does not fit all • Champions are needed • Dependent on a corporate database • Builds on content, concepts and substance of other management systems • Recognize that organizations have frequent leadership changes, and need to develop a means for continuity in asset management
Examples - how asset management is used • New York State • Washington State • Montana
NYSDOT’s Program Update Process • Tradeoff analysis • Using forecasts to set program goals and allocations • Examples:
NYSDOT’s Program Update Process • Executive Level Review • Looking across programs and regions • Direct result of asset management.
Washington State DOT • Use asset management for 20-year forecasting of revenues and costs • Example:
Highway System Plan Existing Revenues (11.4) Historical Revenue Increases (18.3) Fully Funded Plan (41.0) 20 Year Costs (5) (3) (6) (1) (2) (7) (4) (8) (5) Environmental Retrofit (0.74) (1) Maintenance (2.72) (6) Economic Init. (1.09) (2) Traffic Ops. (0.45) (7) Core HOV Lanes (1.69) (3) Preservation (4.75) (8) Mobility (27.33) (4) Safety (2.11) 1999-2018 (1997 Billion $) 20 Year Revenue Scenarios $0.0 $41.0 $11.4 $18.3 PPSC 6/17/97
Montana DOT • Similar budget to some counties • Asset management is part of the performance planning process • Examples:
Performance Programming Annual Cycle Updated + 5 years POLICY DIRECTION FROM STATEWIDE PLAN Policy Module * DEC. PERFORMANCE OBJECTIVES RESOURCE CONSTRAINTS INVESTMENT ANALYSIS Funding Plan Module FUNDING PLAN APPROVAL * APRIL SYSTEMS PERFORMANCE QUERY TOOL PROJECT NOMINATION Program Development Module TECHNICAL REVIEW PUBLIC COMMENT STIP APPROVALS AUG.
Funding Plan Module Performance Objectives Investment Analysis Resource Constraints Funding Plan GOAL: A matrix with sufficient detail to allow various roll-ups with funding either Directly or Proportionately based on Performance Example: Recon to address Capacity Recon to Geom Design stand. Rehab /Recon Bridge NHS STRATEGY Financial District Rehab Pav Pres. Safety Misc. 1 $ $$ $$$ $ $$ $ $$ 2 $$ $ $ $$ $$ $$ $$ 3 $$ $$$ $$$ $ $$ $ $ 4 $$ $$$ $$ $$ $$ $ $ 5 $$$ $$ $$ $ $$ $$ $
Asset Management: A Tool for Managing Highway Assets Performance and Asset Valuation
Performance • What is it? • Why is it important? • What have we learned?
Performance What is it? Operational indicators: e.g miles of road accidents, roughness Mission: smooth, safe, economic and efficient road systems • Link between the user and the physical asset Stakeholders: service providers private and commercial road users, policy makers & regulators [Modified from Paterson and Humplick]
Performance Why is it important? • Fundamental concept • Provides link to decision making • Critical to identifying the true value of assets • Foundation for performance based planning
Performance What have we learned? • For example, Minnesota • Three areas: • System performance • Public values/issues • Organizational Performance
System Performance Time/ Directness Safety Condition of infrastructure Access/ Basic service levels Public values/issues Environment Socioeconomics Organizational Performance Performance/ Productivity Progress towards targeted focus areas Performance Minnesota -