The Normal Distribution (Gaussian Distribution)
The Normal Distribution (Gaussian Distribution). Honors Analysis. Learning Target: I can analyze data using the normal distribution. German mathematician Influenced statistics, algebra, number theory, geometry, physics. Child prodigy! Constructed heptadecagon Triangular numbers

The Normal Distribution (Gaussian Distribution)
E N D
Presentation Transcript
The Normal Distribution(Gaussian Distribution) Honors Analysis Learning Target: I can analyze data using the normal distribution.
German mathematician • Influenced statistics, algebra, number theory, geometry, physics. • Child prodigy! • Constructed heptadecagon • Triangular numbers • Proved Fundamental Theorem of Algebra • Influenced development of statistics, including Normal Distribution (Gaussian Distribution) Carl Friedrich Gauss (1777-1855)
Imagine you took a test in two different classes. • In the first class, you made a 93%. The class mean was a 96%, and the standard deviation was 3%. • In the second class, you made a 78%. The class mean was a 74%, and the standard deviation was 2%. Which test performance was better?
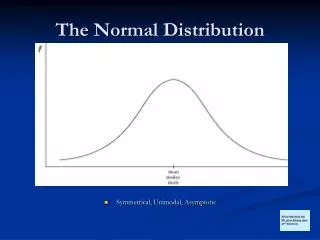
(Approximately) 68% within 1 std dev. of mean • 95% within 2 std. deviations of mean • 99.7% fall within 3 standard deviations of mean 68-95-99.7 Rule
Calculate the mean (central value on curve) • Each region increases or decreases by one standard deviation from the mean • Ex: Test score mean: 74% Std. dev: 2% Labeling a Simple Normal Curve
So what happens if you want to calculate a percentage for a value that ISN’T on your normal curve? • Ex: PSAT math test with mean of 48 and a std. deviation of 3. What percent of scores are below 50?
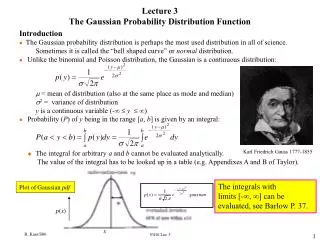
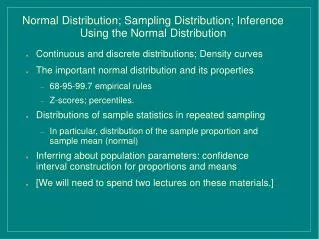
Normal distribution with a mean of 0 and a standard deviation of 1. • Total area under curve = 1 • Area to left of a given value on the curve gives the percentile rank – percent of scores LOWER than a given score. Standard Normal Distribution
You can convert values to standard normal distribution form by calculating a z-score: • Z-Score percentages can be looked up in a table or on a calculator. Z-Scores