Download

1 / 29
290 likes | 440 Vues
S&P 500 Energy Sector. Luke DiTomas Alex Foisel Ian McLeod. February 10, 2009. Agenda. Size and Composition Industry Analysis Economic Analysis Financial Analysis Valuation Analysis Recommendation. Size and Composition. Portfolio Weights.

E N D
S&P 500 Energy Sector Luke DiTomas Alex Foisel Ian McLeod February 10, 2009
Agenda • Size and Composition • Industry Analysis • Economic Analysis • Financial Analysis • Valuation Analysis • Recommendation
Size and Composition Portfolio Weights • The energy sector in the SIM portfolio is currently underweight when compared to the S&P 500 by 6.04% S&P 500 Weight SIM Weight
S&P 500 and Sector Performance The energy sector: Contains 39 stocks 3rd largest market cap* 4th best YTD return: (3.16%)* 6th best YTD return in 2008: (36.74%) Size and Composition *As of January 30, 2009
Top Stocks Top 10 energy stocks based on S&P 500 Index Weight† ConocoPhillips is currently held in the SIM portfolio* BP is currently the only other energy stock in the SIM portfolio Size and Composition † As of February 6, 2009
Size and Composition Sector Composition • Natural gas transmission & distribution • This industry classification includes establishments engaged in both the transmission and distribution of natural gas, but not in distribution to end users • Pipe lines, except natural gas • This industry classification includes establishments engaged in the gathering system and transportation via pipeline of refined and semi-refined products • Oil & gas field machinery & equipment • This category covers establishments primarily engaged in the manufacturing of machinery and equipment for use in oil and gas fields • Petroleum (Integrated) • This category covers establishments primarily engaged in the exploration, production, refinement, transportation and sale of crude oil and natural gas • Petroleum (Producing) • This industry classification includes establishments engaged in the exploration, developing and producing natural gas, crude oil and natural gas liquids • Coal • This industry includes establishments primarily engaged in mining operations producing bituminous coal, anthracite, and lignites
Size and Composition Energy Stocks • BP- Petroleum (Integrated) • Engages in the exploration, production, transportation, and sale of crude oil and natural gas • ConocoPhillips- Petroleum (Integrated) • Operates as an integrated energy company which explores, produces and markets crude oil, natural gas and natural gas liquids • Pengrowth Energy Trust- Petroleum (Producing) • Engages in the acquisition, ownership and management of working interests and royalty interests in oil and natural gas properties • Stock price quotes and market caps as of February 9, 2009
Industry Industry Analysis • Mature phase of life cycle • Global economy influence • Foreign & domestic economies • Global recession • Credit crisis • OPEC • Controls 40% of world’s crude oil • Government factors • Volume controls • Price regulation • Imposition of taxes and subsidies • External factors • Threat to entry • Intensity of rivalry • Supplier bargaining power • Buyer bargaining power • Substitutes • Inputs: crude oil, labor, equipment / outputs: fuels, plastics Source: EIA
Industry Industry Analysis Cont. • Threat to entry (Low) • High start-up costs • Economies of scale • Multiple permits and licenses needed for exploration of oil • Oil exploration requires large amounts of cash reinvested in the business each year • Intensity of rivalry (High) • Heightened government control has restricted access to new upstream resources • Oil and gas are facing growing competition from other fuel sources • Increasing difficulties in extracting the remainder of the world’s oil will lead companies to strive for greater efficiencies - hence increasing rivalry • Increasing security of supply and transport costs has pushed companies to build plants closer to major demand centers
Industry Industry Analysis Cont. • Supplier bargaining power (Moderate) • Foreign governments require permits and licenses in order to conduct drilling/extraction • Facilities need specialized parts and equipment to ensure proper functioning • Vertical integration has reduced the reliance of input suppliers • Buyer bargaining power (Low) • Commodity traders effect oil prices, shifting price power away from buyers • Demand by foreign countries is expected to increase • Substitutes (Moderate) • Although there is movement towards alternative energies, there hasn’t been a sustainable energy source which could be a true substitute for oil • Oil is one of the main commodities that drives the US/global economy
Industry Business Segmentation • Exploration & Development • Hydrocarbon Production • Shipping • Refining & Blending • Storage • Distribution • Market Value Chain Exploration & Development Hydrocarbon Production Shipping Refining & Blending Storage Exploration & Development Distribution Hydrocarbon Production Market Shipping Source: UTC Energy Investment Refining & Blending Storage Distribution Market
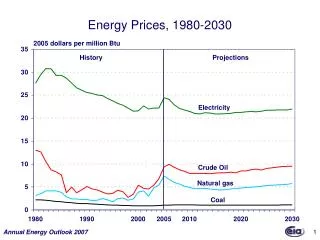
Industry Rise in Future Crude Oil Prices • Subsiding global recession • Rise in crude oil prices and demand • Turnaround in company earnings and job numbers • The dollar’s rally ends • Demand in China and India • Growing rapidly from continued industrialization • Factories expected to pump up crude oil demand • OPEC crude oil pricing goals • OPEC countries need $60 to $80 per barrel • To balance budgets and invest in social programs • Further supply cuts
Industry Rise in Crude Oil Prices Cont. • Crude oil producers • Crude oil is becoming scarcer • Price of crude oil too low to support the income needs of producing countries • Alternative energy • Start-up phase • High costs • Hard to access more capital • Expensive to implement • Lack of demand given lower crude oil prices • Traditional energy has more benefits • Cheaper source • Fossil fuels readily available • Easy to use • Easily transportable
Industry Alternative Energy • Solar • Advantages: • Always there with no pollution being created • Disadvantages: • Low efficiency (15%) which can only be compensated for by large collecting areas • Very high initial costs • Lack of adequate storage materials (batteries) • High cost to the consumer • Wind • Advantages: • None on large scale; supplemental power in windy areas • Disadvantages: • Relatively low efficiency (30%) • Disruption of migratory birds (note this is what killed the recently proposed Columbia River Gorge wind turbine project) • Unreliable and its strength depends on local weather patterns, temperature, time of year and location • Equipment is very expensive compared to other energy sources and initial expense is high
Industry Alternative Energy Cont. • Biomass • Advantages: • Theoretically inexhaustible fuel source • Alcohols and other fuels produced by biomass are efficient, viable, and relatively clean-burning • Disadvantages: • Could contribute a great deal to global warming and create pollution if directly burned • Still an expensive source, both in terms of producing the biomass and converting it to alcohols • On a small scale there is most likely a net loss of energy
Economic Crude Oil Prices vs. Energy Sector Crude Oil Prices
Economic Regression: Crude Oil Prices and Energy Sector
Economic Yen/Euro Cross vs. Crude Oil Prices Yen/Euro Cross Crude Oil Prices
Economic Regression: Yen/Euro Cross and Crude Oil Prices • Correlation: 0.7919 • R-square: 0.6272
Financial EPS Growth Rates • All growth rates represent a 3, 5, or 10-year trailing average
Financial 10-Year EPS Growth Rate
Financial Revenue Growth Rates • All growth rates represent a 3, 5, or 10-year trailing average
Financial Pre-Tax Margins • All margins represent a 5-year trailing average
Financial Energy Sector Free Cash Flow • All cash flows represent 12-month calendar years
Valuation Sector Segmentation • Segmented the sector based on SIC code • Established in 1937 , The Standard Industrial Classification (abbreviated SIC) is a United States Government system for classifying industries by a four-digit code • Segmented sector by SIC code: • Natural gas Transmission &Distribution- 7 stocks • Pipe Lines, Except Natural Gas- 2 stocks • Oil & Gas Field Machinery & Equipment- 12 stocks • Petroleum (Integrated)- 12 stocks • Petroleum (Producing)- 10 stocks • *Petroleum stocks make up over 56% of sector • Coal- 3 stocks Sector Weight by SIC Code
Valuation Valuation Analysis • Price/Earnings Ratio • Energy sector mean: 12.3 • S&P 500 mean: 18.2 • Earnings are very correlated to oil prices • Gasoline sold for 37% less in Q408 than Q407 • OPEC production cuts • Met apx. 67% of the total 4.2 million barrel-per-day-cut • Additional exploration costs • Real GDP explains about 93% of the demand for petroleum products • Price/Earnings/Growth Ratio • Energy sector mean: 1.4 • S&P 500 mean: 1.3 • Additional OPEC production cuts • Analyst/U.S. Government oil price predictions • Consensus 2009 price per barrel- apx. $60 • Optimistic analysts- $100 per barrel Price/Earnings Ratio Price/Earnings/Growth Ratio
Valuation Valuation Analysis Cont. • Price/EBITDA • Energy sector mean: 5.8x • S&P 500 mean: 8.5x • Decrease in EBITDA margins • Return on Equity • Energy sector mean: 22.1% • S&P 500 mean: 17.0% • Increased revenue arising from higher petroleum product prices flowed through to profit • 10-year revenue growth rate for 6 largest oil refiners- 17.99% Price/EBITDA Return on Equity
Valuation Technical Analysis • Period of consolidation • Lower volumes • Wedge formation • Upside breakout imminent • Constant highs, higher lows • 20 & 50-day moving averages • Broken to the upside • Creation of new support levels • Relative strength index (RSI) • Upward trend developing • Moving average convergence divergence (MACD) • Narrow gap • ADX directional movement index • Crossover signals a buy Source: Stockcharts.com
Recommendation Recommendation • Current SIM Weight: 8.05% • Current S&P 500 Weight: 14.09% • Currently underweight 604 basis points • Underweight the sector by 209 basis points relative to the S&P 500 • An increase in current SIM Weight of 3.95% • Why not underweight more? • Energy prices near bottom • Valuation looks very cheap • Increase in global energy demand • Why not overweight? • Short-term demand for oil could further contract • Recession could extend longer than expected