Download
1 / 1
10 likes | 146 Vues
Neutron Beam Intensity Measurement For The NPDGamma Experiment by William Parsons University of Tennessee at Chattanooga. Faculty Mentor: Joshua Hamblen; Team member: Jeremy Stewart;

E N D
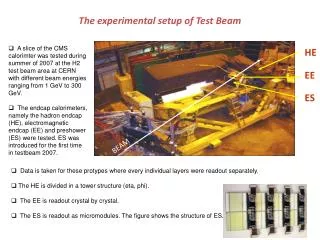
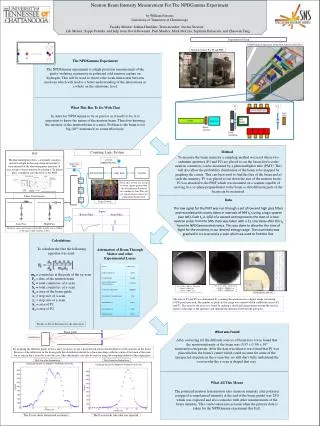
Neutron Beam Intensity Measurement For The NPDGamma Experimentby William ParsonsUniversity of Tennessee at Chattanooga Faculty Mentor: Joshua Hamblen; Team member: Jeremy Stewart; Lab Mentor: Seppo Penttila; and help from David Bowman, Paul Mueller, Mark McCrea, Septimiu Balascuta, and Zhaowen Tang The NPDGamma Experiment The NPDGamma experiment is a high-precision measurement of the parity-violating asymmetry in polarized cold neutron capture on hydrogen. This will be used to observe the weak interaction between nucleons which will lead to a better understanding of the interactions as a whole on the subatomic level. What This Has To Do With That In order for NPDGamma to be as precise as it needs to be, it is important to know the nature of the neutron beam. Therefore knowing the intensity of the neutron beam is a must. Problem is the beam is too big (1010 neutrons/s) to count effectively. Experimental Setup NPDGamma Experiment Setup with Aperture Placement Housing Scanner For P2 and PMT Shielding PMT P1 P2 To measure the beam intensity a sampling method was used where two cadmium apertures (P1 and P2) are placed to cut the beam down so the neutron counts/sec can be measured by a photomultiplier tube (PMT). This will also allow the probability distribution of the beam to be mapped by graphing the counts. This can been used to find the flux of the beam and as such the intensity. P1 was placed to cut down the size of the neutron beam. P2 was attached to the PMT which was mounted on a scanner capable of moving in a xy-plane perpendicular to the beam so that different parts of the beam can be measured. Data The raw signal for the PMT was run through a set of low and high pass filters and recorded with counts taken in intervals of 999 t0’s using a logic system (see left). Each t0 is 1/60 of a second and represents the start of a new neutron pulse from the SNS. Data was taken with a 21.1ms delay after the t0 from the NPDGamma electronics. This was done to allow for the time of flight for the neutrons in our desired energy range. The count data was graphed in a x-scan and a y-scan which we used to find the flux. Method Counting Logic System PMT The photomultiplier tube is a extremely sensitive detector of light in the range from ultraviolet to near-infrared of the electromagnetic spectrum. It was set up to detect neutrons by placing a 6Li doped glass scintillator onto the front of the PMT t0 Output (npdg DAQ start) Output from PMT Discriminator Logic Gate Counter Low Pass The Logic system was set up to count signals greater then the discriminator threshold in a window of 5ms. This cut out signals from cosmic rays and gamma background. High Pass Filter Construction Low Pass Logic System Signal Before Filter After Filter Low Pass High Pass The filters where constructed with R=50Ω, L=4μH, and C=1500ρF so the signal width would be at 80ns Calculations To calculate the flux the following equation was used: m0 = counts/sec at the peak of the xy-scan F0 = flux of the neutron beam Sx = total counts/sec of x-scan Sy = total counts/sec of y-scan Ag = area of the beam guide Δx = step size of x-scan Δy = step size of y-scan A1 = area of P1 A2 = area of P2 Attenuation of Beam Through Matter and other Experimental Losses P1 P2 P2= (4.5 ± .023) x 104 pixels2 = 0.0012 ± 0.000062 in2 = 0.0077 ± 0.00040 cm2 P1= (3.03 ± .0042) x 107 pixels2 = 0.082 ± 0.0011 in2 = 0.529 ± 0.0071 cm2 Both Apertures with ruler The area of P1 and P2 was determined by scanning the apertures into a digital image containing 19200 pixels per inch. The number of pixels in the image was counted which yielded the area of P1 and P2. The error for the areas was found by making a small and large polygon around the unclear region of the edge of the apertures and splitting the difference between the polygons. After correcting for the different sources of beam loss it was found that the neutron intensity of the beam was (5.97 ± 0.39) x 109 neutrons/sec/megawatt. After the data was taken it was found that P1 was placed below the beam’s center which could account for some of the unexpected structure in the y-scan buy we still don’t fully understand the reason why the y-scan is shaped that way. What All This Means The polarized neutron transmission ratio (neutron intensity after polarizer compared to unpolarized intensity at the end of the beam guide) was 28% which was expected and also coincides with other measurements of the beam intensity. This can be taken into account when the primary data is taken for the NPDGamma experiment this Fall. Thanks to David Bowman for the derivation P1 What was Found Beam guide moderator By graphing the different points in the x and y positions we get a general look at how the distribution of the neutrons in the beam. Because of the reflections in the beam guide this distribution should be a Gaussian shape with the center of the beam at the peak but as seen in the y-scan this is not the case. This abnormality can only be seen by using the sampling method of this experiment The Y-Scan of the Neutron Beam The X-Scan of the Neutron Beam The Y-scan shows unexpected asymmetry The X-scan looks like what was expected