Download
1 / 9
90 likes | 111 Vues
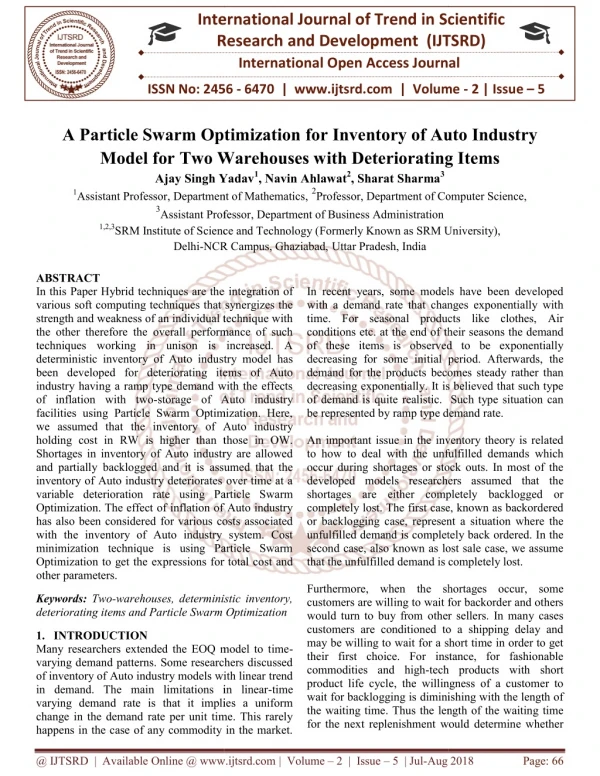
In this Paper Hybrid techniques are the integration of various soft computing techniques that synergizes the strength and weakness of an individual technique with the other therefore the overall performance of such techniques working in unison is increased. A deterministic inventory of Auto industry model has been developed for deteriorating items of Auto industry having a ramp type demand with the effects of inflation with two storage of Auto industry facilities using Particle Swarm Optimization. Here, we assumed that the inventory of Auto industry holding cost in RW is higher than those in OW. Shortages in inventory of Auto industry are allowed and partially backlogged and it is assumed that the inventory of Auto industry deteriorates over time at a variable deterioration rate using Particle Swarm Optimization. The effect of inflation of Auto industry has also been considered for various costs associated with the inventory of Auto industry system. Cost minimization technique is using Particle Swarm Optimization to get the expressions for total cost and other parameters. Ajay Singh Yadav | Navin Ahlawat | Sharat Sharma "A Particle Swarm Optimization for Inventory of Auto Industry Model for Two Warehouses with Deteriorating Items" Published in International Journal of Trend in Scientific Research and Development (ijtsrd), ISSN: 2456-6470, Volume-2 | Issue-5 , August 2018, URL: https://www.ijtsrd.com/papers/ijtsrd15791.pdf Paper URL: http://www.ijtsrd.com/mathemetics/applied-mathamatics/15791/a-particle-swarm-optimization-for-inventory-of-auto-industry-model-for-two-warehouses-with-deteriorating-items/ajay-singh-yadav<br>

E N D
International Research Research and Development (IJTSRD) International Open Access Journal A Particle Swarm Optimization for Inventory of Auto or Two Warehouses with Deteriorating Items Ajay Singh Yadav1, Navin Ahlawat2, Sharat Sharma3 Department of Mathematics,2Professor, Department of Computer Science Assistant Professor, Department of Business Administration SRM Institute of Science and Technology (Formerly Known as SRM University), NCR Campus, Ghaziabad,Uttar Pradesh, India International Journal of Trend in Scientific Scientific (IJTSRD) International Open Access Journal ISSN No: 2456 ISSN No: 2456 - 6470 | www.ijtsrd.com | Volume 6470 | www.ijtsrd.com | Volume - 2 | Issue – 5 A Particle Swarm Optimization Model for Two Warehouses w Ajay Singh Yadav 1Assistant Professor, Department of Mathematics 3Assistant Professor 1,2,3SRM Institute of Science and Technology ( Delhi-NCR Campus, Ghaziabad, f Auto Industry ith Deteriorating Items Department of Computer Science, nown as SRM University), In recent years, some models have been developed with a demand rate that changes exponentially with time. For seasonal products like clothes, Air conditions etc. at the end of their seasons the demand of these items is observed to be exponentially decreasing for some initial period. Afterwards, the demand for the products becomes steady rather than decreasing exponentially. It is believed that such type of demand is quite realistic. Such type situation can be represented by ramp type demand rate. An important issue in the inventory theory is related to how to deal with the unfulfilled demands which occur during shortages or stock outs. In most of the developed models researchers assumed that the shortages are either completely backlogged or completely lost. The first case, known as backordered or backlogging case, represent a situation where the unfulfilled demand is completely back ordered. In the second case, also known as lost sale case, we assume that the unfulfilled demand is completely lost. Furthermore, when the shortages occur, some customers are willing to wait for backorder and others would turn to buy from other sellers. In many cases customers are conditioned to a shipping delay and may be willing to wait for a short time in order to get their first choice. For instance, for fashionable commodities and high-tech products with short product life cycle, the willingness of a customer to wait for backlogging is diminishing with the length of the waiting time. Thus the length of the waiting time for the next replenishment would determine whether the next replenishment would determine whether ABSTRACT In this Paper Hybrid techniques are the various soft computing techniques that synergizes the strength and weakness of an individual technique with the other therefore the overall performance of such techniques working in unison is increased. A deterministic inventory of Auto industry model has been developed for deteriorating items of Auto industry having a ramp type demand with the effects of inflation with two-storage of Auto industry facilities using Particle Swarm Optimization. Here, we assumed that the inventory of Auto indus holding cost in RW is higher than those in OW. Shortages in inventory of Auto industry are allowed and partially backlogged and it is assumed that the inventory of Auto industry deteriorates over time at a variable deterioration rate using Particle Swa Optimization. The effect of inflation of Auto industry has also been considered for various costs associated with the inventory of Auto industry system. Cost minimization technique is using Particle Swarm Optimization to get the expressions for total co other parameters. In this Paper Hybrid techniques are the integration of various soft computing techniques that synergizes the strength and weakness of an individual technique with the other therefore the overall performance of such techniques working in unison is increased. A In recent years, some models have been developed with a demand rate that changes exponentially with time. For seasonal products like clothes, Air conditions etc. at the end of their seasons the demand of these items is observed to be exponentially ing for some initial period. Afterwards, the demand for the products becomes steady rather than decreasing exponentially. It is believed that such type of demand is quite realistic. Such type situation can be represented by ramp type demand rate. stry model has been developed for deteriorating items of Auto industry having a ramp type demand with the effects storage of Auto industry facilities using Particle Swarm Optimization. Here, we assumed that the inventory of Auto industry holding cost in RW is higher than those in OW. Shortages in inventory of Auto industry are allowed and partially backlogged and it is assumed that the inventory of Auto industry deteriorates over time at a variable deterioration rate using Particle Swarm Optimization. The effect of inflation of Auto industry has also been considered for various costs associated with the inventory of Auto industry system. Cost minimization technique is using Particle Swarm Optimization to get the expressions for total cost and ortant issue in the inventory theory is related to how to deal with the unfulfilled demands which occur during shortages or stock outs. In most of the developed models researchers assumed that the shortages are either completely backlogged or st. The first case, known as backordered or backlogging case, represent a situation where the unfulfilled demand is completely back ordered. In the second case, also known as lost sale case, we assume that the unfulfilled demand is completely lost. rmore, when the shortages occur, some customers are willing to wait for backorder and others would turn to buy from other sellers. In many cases customers are conditioned to a shipping delay and may be willing to wait for a short time in order to get first choice. For instance, for fashionable tech products with short product life cycle, the willingness of a customer to wait for backlogging is diminishing with the length of the waiting time. Thus the length of the waiting time Keywords: Two-warehouses, deterministic inventory, deteriorating items and Particle Swarm Optimization deteriorating items and Particle Swarm Optimization warehouses, deterministic inventory, 1.INTRODUCTION Many researchers extended the EOQ model to time varying demand patterns. Some researchers discussed of inventory of Auto industry models with linear trend in demand. The main limitations in linear varying demand rate is that it implies a uniform change in the demand rate per unit time. This rarely happens in the case of any commodity in the market. happens in the case of any commodity in the market. Many researchers extended the EOQ model to time- varying demand patterns. Some researchers discussed Auto industry models with linear trend in demand. The main limitations in linear-time varying demand rate is that it implies a uniform change in the demand rate per unit time. This rarely @ IJTSRD | Available Online @ www.ijtsrd.com @ IJTSRD | Available Online @ www.ijtsrd.com | Volume – 2 | Issue – 5 | Jul-Aug 2018 Aug 2018 Page: 66
International Journal of Trend in Scientific Research and Development (IJTSRD) ISSN: 2456-6470 the backlogging would be accepted or not. In many real life situations, during a shortage period, the longer the waiting time is, the smaller is the backlogging rate would be. Therefore, for realistic business situations the backlogging rate should be variable and dependent on the waiting time for the next replenishment. Many researchers have modified inventory policies by proportional partial backlogging rate”. 2. RELATED WORKS Zangwill (1966) developed a production multi period production scheduling model with backlogging. Inventory models with a mixture of backorders and lost sales were formulated by Montgomery et al. (1973). Economic production lot size model for deteriorating items with partial backordering was suggested by Wee (1993). A comparison of two replenishment strategies for the lost sales inventory model was presented by Donselaar et al. (1996). Time-limited free back-orders EOQ model was formulated by Abbound and Sfairy (1997).Chang and Dye (1999) developed an inventory model in which the proportion of customers who would like to accept backlogging is the reciprocal of a linear function of the waiting time. Papachristos and Skouri (2000) established a partially backlogged inventory model in which the backlogging rate decreases exponentially as the waiting time increases. An EOQ inventory model for items with Weibull distribution deterioration rate and ramp type demand was formulated by Wu (2001). Shortages in inventory were allowed and assumed to be partially backlogged. Teng et al. (2002) presented an optimal replenishment policy for deteriorating items with time-varying demand and partial backlogging. An EOQ model for deteriorating items with time-varying demand and partial backlogging was suggested by Teng et al. (2003). Chu and Chung (2004) discussed the sensitivity of the inventory model with partial backorders. An EOQ model with time varying deterioration and linear time varying demand over finite time horizon was proposed by Ghosh and Chaudhuri (2005). Shortages in inventory were allowed and partially backlogged with waiting time dependent backlogging rate. Optimal ordering policy for deteriorating items with partial backlogging was formulated by Ouyang et al. (2006) when delay in payment was permissible. Dye (2007) proposed joint pricing and ordering policy for deteriorating inventory. Shortages in inventory were allowed and partial backlogged. An inventory lot-size model for deteriorating items with partial backlogging was formulated by Chern et al. (2008). Authors have taken time value of money in to consideration. The demand was assumed to fluctuating function of time and the backlogging rate of unsatisfied demand was a decreasing function of the waiting time. Taleizadeh AA, et.al. (2008). developed Optimizing Multi-Product Multi-Constraint Inventory Control Systems with Stochastic Replenishment and an EOQ Joint Replenishment Policy to Supply Expensive Imported Raw Materials with Payment in Advance. multi products, multi constraints newsboy problem with batch order and discount. Taleizadeh AA, et.al (2009) extended A Particle Swarm Optimization Approach for Constraint Joint Single Buyer-Single Vendor Inventory Problem with Changeable Lead-Time and (r,Q) Policy in Supply Chain. developing a Multiproducts Newsboy Problem with a Hybrid Method of Fuzzy Simulation and Simulated Annealing. a Hybrid Method of Pareto, TOPSIS and Genetic Algorithm to Optimize Multi- Product Multi-Constraint Inventory Control Systems with Random Fuzzy Replenishments. optimizing multi product multi constraints Bi-objective newsboy Problem with discount by Hybrid Method of Goal Programming and Genetic Algorithm. a Hybrid Method to Optimize Bi-Objective Single Period Newsboy Problem with Fuzzy Cost and Incremental Discount. multi-product multi-constraint inventory control systems with stochastic replenishment and discount under Fuzzy Purchasing Price and Holding Costs. multi-product multi-constraint control systems with stochastic period length and total discount under fuzzy purchasing price and holding costs. optimizing multi-product multi-constraint bi- objective newsboy problem with discount by hybrid method of goal programming and genetic algorithm. a harmony search algorithm to optimize chance constraint stochastic inventory systems with dynamic demand. joint replenish-up-to multi products EOQ with fuzzy rough demand. N. Jawahar and A.N. Balaji (2009) developed A genetic algorithm for the two- stage supply chain distribution problem associated with a fixed charge. Haixin Zhang et.al. (2013) suggested A modified multi-criterion optimization genetic algorithm for collaborative supply chain. S.P. Nachiappan and N. Jawahar (2007) developed A genetic algorithm for optimal operating parameters of VMI system in a two- echelon supply chain. Z.H. Che and C.J. Chiang (2010) suggested a modified Pareto genetic algorithm considering the “time inventory order distribution in @ IJTSRD | Available Online @ www.ijtsrd.com | Volume – 2 | Issue – 5 | Jul-Aug 2018 Page: 67
International Journal of Trend in Scientific Research and Development (IJTSRD) ISSN: 2456-6470 for multi-objective build-to-order supply chain planning with product assembly. Keyvan Sarrafha et.al. (2015) developed A bi-objective integrated procurement, production, and distribution problem of a multi-echelon supply chain network design: A new tuned MOEA. Ata Allah Taleizadeh et.al. (2011) extended Multiple-buyer multiple-vendor multi- product multi-constraint supply chain problem with stochastic demand and variable lead-time: A harmony search algorithm. Wei-Chang Yeh and Mei-Chi Chuang (2011) suggested Using multi-objective genetic algorithm for partner selection in green supply chain problems. S.A. Torabi, et.al. (2006) extended A hybrid genetic algorithm for the finite horizon economic lot and delivery scheduling in supply chains. Pavan Kumar Naraharisetti et.al. (2007) suggested Optimal supply chain redesign using genetic algorithm. Moon-Chan Kim et.al. (2008) developed Forward–backward analysis of RFID- enabled supply chain using fuzzy cognitive map and genetic algorithm. Partha Guchhait et.al. (2013) extended A production inventory model with fuzzy production and demand using fuzzy differential equation: An interval compared genetic algorithm approach. U.K. Bera et.al. (2012) extended Inventory model with fuzzy lead-time and dynamic demand over finite time horizon using a multi-objective genetic algorithm. Ata Allah Taleizadeh et. al. (2009) suggested A hybrid method of Pareto, TOPSIS and genetic algorithm to optimize multi-product multi- constraint inventory control systems with random fuzzy replenishments. Ali Roozbeh Nia et.al. (2014) extended A fuzzy vendor managed inventory of multi- item economic order quantity model under shortage: An ant colony optimization algorithm. Javad Sadeghi et. al. (2014) extended optimizing a hybrid vendor- managed inventory and transportation problem with fuzzy demand: An improved particle swarm optimization algorithm. Manas Kumar Maiti (2011) developed A fuzzy genetic algorithm with varying population size to solve an inventory model with credit-link ed promotional demand in an imprecise planning horizon. H. Altay Guvenir and Erdal Erel (1998) suggested Multicriteria inventory classification using a genetic algorithm. Ali Diabat (2014) extended Hybrid algorithm for a vendor managed inventory system in a two-echelon supply chain. K.L. Mak et. al. (1999) developed optimal inventory control of lumpy demand items using genetic algorithms. A.K. Maiti et. al. (2006) extended An application of real- coded genetic algorithm (RCGA) for mixed integer non-linear programming in two-storage multi-item inventory model with discount policy. Kuo-Ping Lin et.al. (2010) developed A simulation of vendor managed inventory dynamics using fuzzy arithmetic operations with genetic algorithms. Sung-Pil Hong and Yong-Hyuk Kim (2009) suggested A genetic algorithm for joint replenishment based on the exact inventory cost. Manas Kumar Maiti and Manoranjan Maiti (2007) extended Two-storage inventory model with lot-size dependent fuzzy lead-time under possibility constraints via genetic algorithm. Arindam Roy et. al. (2009) developed a production inventory model with stock dependent demand incorporating learning and inflationary effect in a random planning horizon: A fuzzy genetic algorithm with varying population size approach. S.M. Disney et. al. (2000) suggested Genetic algorithm optimisation of a class of inventory control systems. 3. Assumptions and Notations In developing the mathematical model of the inventory system the following assumptions are being made: A single item is considered over a prescribed period T units of time. The demand rate of Auto industry D(t) at time t is deterministic and taken as a ramp type function of time i.e. D(t) e The replenishment rate is infinite and lead-time is zero. When the demand for goods is more than the supply. The variable rate of deterioration in both warehouse is taken as β (t) = βt. Where 0< β << 1 and only applied to on hand inventory. No replacement or repair of deteriorated items is made during a given cycle. The owned warehouse of Auto industry (OW) has a fixed capacity of W units; the rented warehouse of Auto industry (RW) has unlimited capacity. The goods of OW are consumed only after consuming the goods kept in RW. In addition, the following notations are used throughout this paper: Iow(t) The inventory of Auto industry level in OW at any time t. Irw(t) The inventory of Auto industry level in RW at any time t. CW The capacity of the own warehouse of Auto industry. Q The ordering quantity of Auto industry per cycle. t (t )H(t ) , 0 , 0 @ IJTSRD | Available Online @ www.ijtsrd.com | Volume – 2 | Issue – 5 | Jul-Aug 2018 Page: 68
International Journal of Trend in Scientific Research and Development (IJTSRD) ISSN: 2456-6470 T HO Planning horizon. Inflation rate of Auto industry. The holding cost of Auto industry per unit per unit time in OW. The holding cost of Auto industry per unit per unit time in RW. where HO < HR The deterioration cost of Auto industry per unit. 4. Formulation and solution of the model The inventory levels of Auto industry at OW of Auto industry are governed by the following differential equations: dI (t) (t)I(t), dt dI (t) (t)I(t) e , dt And dI (t) e e , dt with the boundary conditions, I0W(0) =CW and I(t1) = 0 The solutions of equations (1), (2) and (3) are given by 22 W ow I (t) e C , 0 3 3 22 1 1 6 ow respectively. The inventory level of Auto industry at RW of Auto industry is governed by the following differential equations: dI (t) (t)I(t) e , dt With the boundary condition Irw(0)=0, the solution of the equation (8) is 1 2 6 Due to continuity of Io(t) at point t = , it follows from equations (5) and (6), one has 3 3 2 2 2 2 1 1 6 SC The shortage cost of Auto industry per unit per unit time. The opportunity cost of Auto industry due to lost sales. The replenishment cost of Auto industry per order. C1 A HR DC ow 0 t (1) ow t t (2) 1 t ow t1 t T (3) (4) t t (5) (t t ) t t t I (t) e (t t) e , (6) ow 1 1t t t1 t T I (t) e e e , And (7) t rw 0 t (8) 2 2 2 3 3 t 2 t t (9) I (t) ( t) t (t t ) e , rw 1 (t ) C e e (t ) e W (10) 3 1 3 (t ) C e (t ) W 1 6 @ IJTSRD | Available Online @ www.ijtsrd.com | Volume – 2 | Issue – 5 | Jul-Aug 2018 Page: 69
International Journal of Trend in Scientific Research and Development (IJTSRD) ISSN: 2456-6470 The total average cost consists of following elements: I. Ordering cost of Auto industry per cycle = A II. Holding cost of Auto industry per cycle (H1) in OW 1 ( ) O w H H I t e dt I III. Holding cost of Auto industry per cycle (CHR) in RW IV. Cost of deteriorated units of Auto industry per cycle (CD) V. Shortage cost of Auto industry per cycle (CS) T (t t) C w t VI. Opportunity cost of Auto industry due to lost sales per cycle ( (11) t t t ( ) t e dt (12) 1 0 0 w 0 t H H I ( ) t e dt (13) 2 R rw 0 1 t t t (t ) D t I (t)e dt t I (t)e dt t I (t)e dt (14) C rw 0 w 0 w 0 0 1 S I (t)e dt (15) 0 1 C ) 0 T t (t t) C ( 1 e )e e dt (16) 1 1 t 1 Therefore, the total average cost per unit time of our model is obtained as follows Ordering T industry in RW+ Deterioration cost of Auto industry + Shortage cost of Auto industry + Opportunity cost of Auto industry T 1 K(t1 , T) cost of Auto industry + Holding cost of Auto industry in OW+ Holding cost of Auto R(t1 , T) (say) (17) @ IJTSRD | Available Online @ www.ijtsrd.com | Volume – 2 | Issue – 5 | Jul-Aug 2018 Page: 70
International Journal of Trend in Scientific Research and Development (IJTSRD) ISSN: 2456-6470 5. Particle Swarm Optimization (PSO) Particle Swarm Optimization (PSO) introduced by Kennedy and Eberhart in 1995 is a population based evolutionary computation technique. It has been developed by simulating bird flocking fish schooling or sociological behavior of a group of people artificially. Here the population of solution is called swarm which is composed of a number of agents known as particles. Each particle is treated as point in d-dimensional search space which modifies its position according to its own flying experience and that of other particles present in the swarm. The algorithm starts with a population (swarm) of random solutions (particles). Each particle is assigned a random velocity and allowed to move in the problem space. The particles have memory and each of them keeps track of its previous (local) best position. ?? Particle’s velocity ?? Particle’s position b number of elements in a particle, q Inertia weight of the particle, m generation number, a1, a2 acceleration constants, e and random value between 0 and 1 ?????? Local best position of the particle, ?????? Global best position of particle in the swarm ?? + ??× ?????× ??????? − ???? ? + ??× ?????× ??????? ???= ???? + ?? ? ? ? ? ? ? ? ?= ? × ???? ? ? − ???? ? @ IJTSRD | Available Online @ www.ijtsrd.com | Volume – 2 | Issue – 5 | Jul-Aug 2018 Page: 71
International Journal of Trend in Scientific Research and Development (IJTSRD) ISSN: 2456-6470 6. Numerical Illustration To illustrate the model numerically the following parameter values are considered. η = 50 units, A= Rs. 100 per order, θ = 0.05 unit, HO = Rs. 3.0 per unit per year, γ = 0.2 unit, HW = Rs. 10.0 per unit, β =0.002 unit, SC = Rs. 12.0 per unit per year, Ψ = 0.2 year, C1 = Rs. 4.0 per unit, α = 0.1 unit, T = 1 year, Then for the minimization of total average cost and with help of software. the optimal policy can be obtained such as: t1 = 0.799224 year, S = 38.597235 units and K= Rs.158.115354 per year. Therefore, numerical solution of these equations is obtained by using the software MATLAB 7.0.1. Particle Swarm Optimization (PSO) population= 90, generations=600, cognitive learning factor=4, cooperative factor=4, social learning factor=0.10, inertial constant=0.10 and number of neighbors=10. Since the model is integer in nature, reaching an analytical solution (if any) to the problem is difficult (Gen and Cheng, 1997). So we need to use Meta heuristic algorithms. To solve the models under meta-heuristic approach, four hybrid intelligent algorithms of harmony search (Taleizadeh et al., 2009), simulated annealing (Taleizadeh, 2008, 2009), genetic algorithm Taleizadeh (2008, 2009), and particle swarm optimization (Taleizadeh et al., 2009) are used. A comparison of the results in Tables 1 and 2 for increasing and decreasing demand show that Hybrid Algorithms method performs the best. Table: - 1 Best results of purpose function by different algorithms for Maximum demand Hybrid Algorithms Product’s Maximum inventory Level 1 2 Particle Swarm Optimization 720 803 Table: - 2 Best results of purpose function by different algorithms for Minimum demand. 7. Conclusion The main pillars of soft computing are Particle Swarm Optimization all of these have been successfully applied in isolation to solve practical problems in various fields where conventional techniques have been found inadequate. However these techniques are complementary to each other and they may work synergistically combining the strengths of more than one of these techniques as the situation may occasionally demand. Hybrid systems are systems where several techniques are combined to solve a problem. Needless to say that such amalgamation must be used only if it returns better results than any of these techniques in isolation. Based on how or more systems are combined hybrid systems have been Maximum profit (Rs.) 3012.15 3 4 5 370.4 522.5 782 Hybrid Algorithms Product’s Maximum inventory Level 1 2 3 520 603 170.4 Maximum profit (Rs.) 2012.15 4 5 Particle Swarm Optimization 322.5 582 classified into three broad categories viz sequential, auxiliary and embedded hybrid systems. This study incorporates some realistic features that are likely to be associated with the inventory of any material. Decay (deterioration) overtime for any material product and occurrence of shortages in inventory are natural phenomenon in real situations. Inventory of Auto industry shortages are allowed in the model using Particle Swarm Optimization. In many cases customers are conditioned to a shipping delay, and may be willing to wait for a short time in order to get their first choice. Therefore, this concept is also taken in this model. From the numerical @ IJTSRD | Available Online @ www.ijtsrd.com | Volume – 2 | Issue – 5 | Jul-Aug 2018 Page: 72
International Journal of Trend in Scientific Research and Development (IJTSRD) ISSN: 2456-6470 illustration of the model, it is observed that the period in which inventory holds of Auto industry increases with the increment in backlogging and ramp parameters while inventory period decreases with the increment in deterioration and inflation parameters of Auto industry using Particle Swarm Optimization. Initial inventory level of Auto industry decreases with the increment in deterioration, inflation and ramp parameters while inventory level increases of Auto industry with the increment in backlogging parameter using Particle Swarm Optimization. The total average cost of the system goes on increasing with the increment in the backlogging and deterioration parameters while it decreases with the increment in inflation and ramp parameters using Particle Swarm Optimization. The proposed model can be further extended in several ways. For example, we could extend this deterministic model in to stochastic model. Also, we could extend the model to incorporate some more realistic features, such as quantity discount or the unit purchase cost, the inventory holding cost and others can also taken fluctuating with time using Particle Swarm Optimization. References 1.Abboud, N.E. and Sfairy, R.G. (1997): Time- limited free back-orders EOQ model. Applied Mathematical Modelling (A.M.M.), 21(1), 21-25. demand and variable backlogging with shortages in all cycles. A.M.O., 7(1), 57-68. 8.Montogomery, D.C., Bazaraa, M.S., and Keshwani, A.K. (1973): Inventory models with a mixture of backorders and lost sales. Naval Research Logistics (N.R.L.), 20/2, 255-263. 9.Ouyang, L.Y., Teng, J.T.and Chen, L.H. (2006): Optimal Ordering Policy for Deteriorating Items with Partial Backlogging under Permissible Delay in Payments. Optimization, 34(2), 245-271. Journal of Global 10.Papachristos, S. and Skouri, K. (2000): An optimal replenishment policy for deteriorating items with time-varying demand and partial- exponential-type backlogging. O.R.L., 27, 175- 184. 11.Teng, J.T., Chang, H.J., Dye, C.Y. and Hung, C.H. (2002): An optimal replenishment policy for deteriorating items with time-varying demand and partial backlogging. O.R.L., 30, 387-393. 12.Teng, J.T., Yang, H.L. and Ouyang, L.Y. (2003): On an EOQ model for deteriorating items with time-varying backlogging. J.O.R.S., 54, 432-436. demand and partial 13.Wee, H.M. (1993): Economic production lot size model for deteriorating items with partial back ordering. Computers & Industrial Engineering, 24(3), 449-458. 2.Chang, H.J. and Dye, C.Y. (1999): An EOQ model for deteriorating items with time varying demand and partial backlogging. Journal of the operational research society, 50(11), 1176-1182. 14.Wu, K.S. (2001): An EOQ inventory model for items with Weibull distribution deterioration, ramp type demand rate and partial backlogging. Production planning & control, 12(8), 787 – 793. 3.Chern, M.S., Yang, H.L., Teng, J.T. and Papachristos, S. (2008): Partial backlogging inventory lot-size models for deteriorating models with fluctuating demand under inflation. European Journal of operational research, 191 (1), 125-139. 15.Zangwill, W.I. (1966): A deterministic multi- period production scheduling backlogging. Management Science, 13, 105-119. model with 4.Chu, P. and Chung, K.J. (2004): The sensitivity of the inventory model with partial backorders. European Journal of operational research, 152, 289-295. 16.Taleizadeh A.A., Aryanezhad, M.B. and Niaki, S.T.A. (2008) Optimizing Multi-Product Multi- Constraint Inventory Control Systems with Stochastic Replenishment. Science, 8: 1228-1234. Journal Applied. 5.Donselaar, K.V., Kok T.D., and Rutten W. (1996): Two replenishment strategies for the lost sales inventory model: A comparison. I.J.P.E., 46- 47, 285-295. 17.Taleizadeh, A.A., Niaki AA, Shafii, N. and Ghavamizadeh, R.M. (2009). A Particle Swarm Optimization Approach for Constraint Joint Single Buyer-Single Vendor Inventory Problem with Changeable Lead-Time and (r,Q) Policy in Supply Chain. International Manufacturing Systems, 51(9-12): 1209-1223. 6.Dye, C.Y. (2007): Joint pricing and ordering policy for a deteriorating inventory with partial backlogging. Omega, 35(2), 184-189. journal Advanced 7.Ghosh, S.K. and Chaudhuri, K.S. (2005): An EOQ model for a deteriorating item with trended @ IJTSRD | Available Online @ www.ijtsrd.com | Volume – 2 | Issue – 5 | Jul-Aug 2018 Page: 73
International Journal of Trend in Scientific Research and Development (IJTSRD) ISSN: 2456-6470 of inventory control systems International Journal of Production Economics, Volume 68, Issue 3, Pages 259-278 18.Taleizadeh, A.A. Niaki, S.T.A. and Hosseini, S.V. (2009). Optimizing multi-product multi- constraint bi-objective newsboy problem with discount by hybrid method of goal programming and genetic algorithm. Engineering Optimization. 41: 437-457. 24.Nachiappan, S.P. and Jawahar, N. (2007) A genetic algorithm for parameters of VMI system in a two-echelon supply chain European Journal of Operational Research, Volume 182, Issue 3, Pages 1433-1452. optimal operating 19.Diabat, A. (2014) Hybrid algorithm for a vendor managed inventory system in supply chain European Journal of Operational Research, Volume 238, Issue 1, Pages 114-121. a two-echelon 25.Hong, S.P. and Kim Y.H. (2009) A genetic algorithm for joint replenishment based on the exact inventory cost Computers & Operations Research, Volume 36, Issue 1, Pages 167-175. 20.Guvenir, Multicriteria inventory classification a genetic algorithm Operational Research, Volume 105, Issue 1, Pages 29-37. H.A. and Erel, E. (1998). using European Journal of 26.Pakkala, T.P.M. and Achary, K.K. (1992) A deterministic inventory model for deteriorating items with two ware-houses replenishment rate, Operational Research 57, 157- 167. and Journal finite European of 21.Mak, K.L., Wong, Y.S. and Huang, G.Q. (1999) Optimal inventory control of lumpy demand items using genetic algorithms Computers & Industrial Engineering, Volume 37, Issues 1–2, Pages 273- 276. 27.Yeh, W.C. and Chuang, M.C. (2011) Using multi-objective genetic algorithm for partner selection in green supply chain problems Expert Systems with Applications, Volume 38, Issue 4, Pages 4244-4253. 22.Jawahar, N. and Balaji, A.N. (2009) A genetic algorithm for the two-stage supply chain distribution problem associated with a fixed charge European Journal of Operational Research, Volume 194, Issue 2, Pages 496-537. 28.Che, Z.H., and Chiang C.J. (2010) A modified Pareto genetic algorithm for multi-objective build- to-order supply chain planning with product assembly Advances in Engineering Software, Volume 41, Issues 7–8, Pages 1011-1022. 23.Disney, S.M., Naim, M.M. and Towill, D.R. (2000) Genetic algorithm optimisation of a class @ IJTSRD | Available Online @ www.ijtsrd.com | Volume – 2 | Issue – 5 | Jul-Aug 2018 Page: 74