Download
1 / 6
70 likes | 149 Vues
One important aspect of Roadway design is determining the amount of Earthwork necessary on a project. The execution of earthwork comprises four fundamental operations, viz., cutting, loading, hauling and filling. Except hauling, the costs of all the remaining three operations depend upon the character of the material. The haulage cost is a function of the weight of the material as well as the distance from the place of excavation to the place of fill. Since overhaul is an added cost and as it affects the economy of the project considerably, it is highly desirable to deal with the problem very carefully. This necessitates proper planning of movements of excavated soil of work site from cuts to fills so that the haul distance is minimum to reduce the cost of Earthwork. This may be accomplished graphically by means of a distribution diagram known as the Mass Diagram or Mass Curve or Mass Haul Diagram. It is an important tool in Civil Engineering discipline used to compare the economy of various alternatives methods of Earthwork distributions on road or railway construction schemes to ultimately determine the most feasible option for Earthwork as far as economic viability and suitability is concerned to subsequently reduce the costs, labour, time and the complexity involved in the project. This paper aims at discussing the effectiveness and the suitability of Mass Haul Diagrams in any operation of Earthwork involved in any Civil Engineering project thus undergoing a comprehensive discussion on its various aspects through suitable illustrations as and when required. At the end of this paper, the implications of Mass Diagrams using some popular computer softwares such as MS Excel and Autodesk CIVIL 3D has also been discussed, which considerably increases the efficiency of the project, that is otherwise lost in the preparation of the diagrams using the conventional methods involving manual plotting of graphs. Koustav Dutta | Nilmay Mondal | Mrityunjay Malakar "Mass-Haul Diagrams in Optimization of Earthwork Computations" Published in International Journal of Trend in Scientific Research and Development (ijtsrd), ISSN: 2456-6470, Volume-4 | Issue-3 , April 2020, URL: https://www.ijtsrd.com/papers/ijtsrd30681.pdf Paper Url :https://www.ijtsrd.com/engineering/civil-engineering/30681/masshaul-diagrams-in-optimization-of-earthwork-computations/koustav-dutta<br>

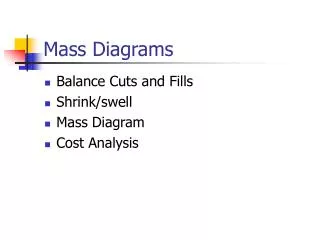
E N D
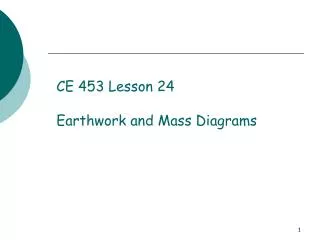
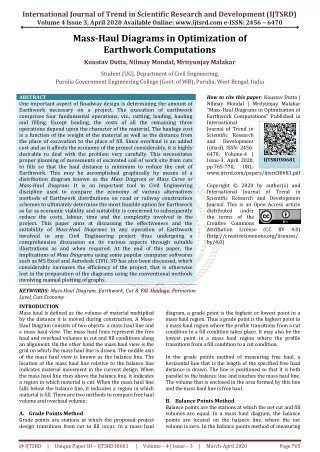
International Journal of Trend in Scientific Research and Development (IJTSRD) Volume 4 Issue 3, April 2020 Available Online: www.ijtsrd.com e-ISSN: 2456 – 6470 Mass-Haul Diagrams in Optimization of Earthwork Computations Koustav Dutta, Nilmay Mondal, Mrityunjay Malakar Student (UG), Department of Civil Engineering, Purulia Government Engineering College (Govt. of WB), Purulia, West Bengal, India ABSTRACT One important aspect of Roadway design is determining the amount of Earthwork necessary on a project. The execution of earthwork comprises four fundamental operations, viz., cutting, loading, hauling and filling. Except hauling, the costs of all the remaining three operations depend upon the character of the material. The haulage cost is a function of the weight of the material as well as the distance from the place of excavation to the place of fill. Since overhaul is an added cost and as it affects the economy of the project considerably, it is highly desirable to deal with the problem very carefully. This necessitates proper planning of movements of excavated soil of work site from cuts to fills so that the haul distance is minimum to reduce the cost of Earthwork. This may be accomplished graphically by means of a distribution diagram known as the Mass Diagram or Mass Curve or Mass-Haul Diagram. It is an important tool in Civil Engineering discipline used to compare the economy of various alternatives methods of Earthwork distributions on road or railway construction schemes to ultimately determine the most feasible option for Earthwork as far as economic viability and suitability is concerned to subsequently reduce the costs, labour, time and the complexity involved in the project. This paper aims at discussing the effectiveness and the suitability of Mass-Haul Diagrams in any operation of Earthwork involved in any Civil Engineering project thus undergoing a comprehensive discussion on its various aspects through suitable illustrations as and when required. At the end of this paper, the implications of Mass Diagrams using some popular computer softwares such as MS Excel and Autodesk CIVIL 3D has also been discussed, which considerably increases the efficiency of the project, that is otherwise lost in the preparation of the diagrams using the conventional methods involving manual plotting of graphs. KEYWORDS: Mass-Haul Diagram, Earthwork, Cut & Fill, Haulage, Formation Level, Cost Economy INTRODUCTION Mass haul is defined as the volume of material multiplied by the distance it is moved during construction. A Mass- Haul Diagram consists of two objects: a mass haul line and a mass haul view. The mass haul lines represent the free haul and overhaul volumes in cut and fill conditions along an alignment. On the other hand the mass haul view is the grid on which the mass haul line is drawn. The middle axis of the mass haul view is known as the balance line. The location of the mass haul line relative to the balance line indicates material movement in the current design. When the mass haul line rises above the balance line, it indicates a region in which material is cut. When the mass haul line falls below the balance line, it indicates a region in which material is fill. There are two methods to compare free haul volume and overhaul volume: A.Grade Points Method Grade points are stations at which the proposed project design transitions from cut to fill occur. In a mass haul How to cite this paper: Koustav Dutta | Nilmay Mondal | Mrityunjay Malakar "Mass-Haul Diagrams in Optimization of Earthwork Computations" Published in International Journal of Trend in Scientific Research and Development (ijtsrd), ISSN: 2456- 6470, Volume-4 | Issue-3, April 2020, pp.765-770, URL: www.ijtsrd.com/papers/ijtsrd30681.pdf Copyright © 2020 by author(s) and International Journal of Trend in Scientific Research and Development Journal. This is an Open Access article distributed under the terms of the Creative Commons Attribution License (http://creativecommons.org/licenses/ by/4.0) IJTSRD30681 (CC BY 4.0) diagram, a grade point is the highest or lowest point in a mass haul region. Thus a grade point is the highest point in a mass haul region where the profile transitions from a cut condition to a fill condition takes place. It may also be the lowest point in a mass haul region where the profile transitions from a fill condition to a cut condition. In the grade points method of measuring free haul, a horizontal line that is the length of the specified free haul distance is drawn. The line is positioned so that it is both parallel to the balance line and touches the mass haul line. The volume that is enclosed in the area formed by this line and the mass haul line is free haul. B.Balance Points Method Balance points are the stations at which the net cut and fill volumes are equal. In a mass haul diagram, the balance points are located on the balance line, where the net volume is zero. In the balance points method of measuring @ IJTSRD | Unique Paper ID – IJTSRD30681 | Volume – 4 | Issue – 3 | March-April 2020 Page 765
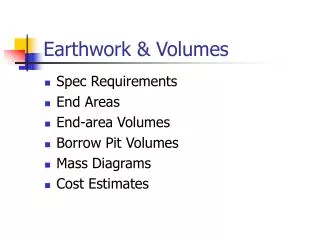
International Journal of Trend in Scientific Research and Development (IJTSRD) @ www.ijtsrd.com eISSN: 2456-6470 free haul, the mass haul line is duplicated and shifted horizontally to the right (where the project transitions from cut to fill) or to the left (where the project transitions from fill to cut) by the free haul distance. Overhaul is the distance for which extra charge of haulage is to be paid. For example, the contractor may offer to haul material upto 150 m at Rs. 5 per m3 but thereafter charge at the rate of Rs. 0.50 per m3 per 100 m. The distance of 150 m is the Free Haul distance and is based on the economical hauling distance of the earth moving plant used by the contractor. It may range from 100 m for a bull dozer to 3000 m for self-propelled scrapers. The haul beyond the Free Haul distance is termed as Overhaul. Waste is the material excavated from cuts but not used for embankments. Borrow is the material needed for the formation of embankments, obtained not construction works but from the borrow-pits. Limit of Economical Haul is the maximum overhaul distance plus the free haul distance. When this limit is reached it is more economical to waste and borrow material. To illustrate, supposing the free haul distance = 300 m, the overhaul is charged at the rate of Rs. 0.50 per m3 per 100 m and the borrowed material at the rate of Rs. 2 per m3. It is evident that, to overhaul 1 m3 over 400 m, it will cost Rs. 2 m3. Therefore the limit for economical haul = 300 m (free haul) + 400 m (overhaul) = 700 m Bulking and Shrinkage: Excavated material is loose and occupies 20% more volume than measured in situ. However when used and compacted in embankment, it shrinks and occupies less volume than when originally in situ. On the other hand excavated rock bulks by 30 to 40%. To allow for this change in volume a correction factor is generally applied to the cut and fills volumes. RESULTS AND DISCUSSIONS Mass-Haul Diagrams are plots of the cumulative volumes of cut and fill along an alignment. Typically, the Mass Diagram is plotted below a profile of the route, with the ordinate at any station representing the sum of the volumes of cut and fill upto that station. It is thus a diagram, usually regular, whose abscissa represent distances and ordinates the volume of Earthwork. The sign convention used for cuts is positive (+ve) and that for fills is negative (-ve). Thus, the total positive volumes are plotted above the distance base and the negative volumes below it. The ends of the ordinates are joined by a smooth curve. The resulting Mass Curve, therefore, consists of positive and negative peaks. Since the slope of the Mass Curve for Earthwork can be positive as well as negative, hence the concept can be used to gain economic advantages in Earthworks. from excavation of Fig. 1: Grade Points Method: In the above image, the green areas are free haul volume, and the red areas are overhaul volume. The magenta circles and arrows indicate the grade points on the mass haul line and profile. The vertical magenta lines illustrate the relationship between the mass haul line and profile in the grade point balancing method. Fig. 2: Balance Points Method: In the above image, the green areas are free haul volume, and the red areas are overhaul. The arrows illustrate the free haul distance in cut and fill conditions. Some of the important associated terms are hereby discussed as follow: Haul Distance (d) is the distance from the working face of excavation to that where the material is deposited. Average Haul Distance (D) is the distance between the centre of gravity of cutting to that of filling, where the material is deposited. Haul is the sum of the products of each load by its haul distance = Σ v. d = V. D, where V is the total volume of excavation. Free Haul is the distance upto which no extra charge is required to be paid. By the combined use of the Mass-Haul Diagrams plotted directly below the longitudinal sections of the proposed centre line it is possible to find: 1.The distances over which cut and fill will balance. 2.Quantities of materials to be moved and the preferable direction of the movement. @ IJTSRD | Unique Paper ID – IJTSRD30681 | Volume – 4 | Issue – 3 | March-April 2020 Page 766
International Journal of Trend in Scientific Research and Development (IJTSRD) @ www.ijtsrd.com eISSN: 2456-6470 3.Areas where the earth may have to be taken from borrow-pits or waste material and the corresponding amounts involved. 4.The best policy to adopt to obtain the most economical use of the earth moving plant. Construction of Mass-Haul Diagram Workout accumulated volume as the algebraic sum of volume of earthwork at each station/ chainage. Draw a base line and mark the stations/ chainage points with suitable scale. From every station/ chainage point, draw vertical line and mark it on a suitable scale for the volume of Earthwork. On the ordinates of each station/ chainage point, mark the respective scaled cumulative heights. Thus, the height of an ordinate at any point on the base line represents the algebraic sum of volume of Earthwork upto that particular station/ chainage point. Join all the points by a smooth curve and the curve thus obtained represents the Mass-Haul Diagram for the corresponding longitudinal profile of the land obtained before. From the Mass Curve, workout quantities of Earthwork such as the earth to be taken away from the site or earth to be brought at the site. Shift the base line above/ below to obtain the most economical condition of cut and fill. Characteristics of Mass-Haul Diagram Upward slope of the curve indicates cuts/ excavations. Downward slope of the curve indicates a fill. The peak occurring at the end of an excavation is known as the maxima point. The peak occurring at the end of an embankment is known as the minima point. The vertical distance between a maxima point and the nest minima point represents the total volume of cutting. The vertical distance between two points, on the curve, which have no maxima or minima points between them represents the volume of Earthwork between their chainages. The algebraic difference between the ordinates at adjacent maxima and minima points represents the haulage between the two points. A horizontal (base) line drawn to intercept the Mass Diagram cuts it in two points, between which the cut exactly balances the fill. The length of the base line intercepted by a loop of the Mass Diagram represents the maximum haul distance in that section. The area bounded by a loop of the mass diagram and the base line measures the haul in that section. The haul is minimum when the base line is so selected that the sum of all the areas cut off by it, without regards to sign, is a minimum. Uses of Mass-Haul Diagram In using a mass diagram, the selection of the base line plays an important role in the economy of the project. Different base lines are assumed, each of which provides possible methods of distributing the excavated material. The one which gives the most economical scheme is selected and the overhaul and haulage is computed. Mass diagrams find its applications in the following activities: Transportation The simplest application of the Mass-Haul Diagram is to calculate the average Transportation distance. For example, if the area under the loop of the Mass Curve is 20,00,000 m4, and the volume of earth transported is 8000 m3, then the average distance of each truck load is 2000000 If the truck carrying capacity is 5 m3, then the number of trucks journeys required is 8000 5 = 1600 If only one truck is used, it would have to travel = 1600 x 250 = 400 km each way. Such calculations will help the Site Engineer-In-Charge to take the decision on the type and the number of trucks (or any other suitable vehicle) to be used. Design There is a close link between the Mass-Haul Diagram and the formation level of the ground. If several formation levels are tried and a Mass-Haul Diagram constructed for each, that formation, which gives the most economical result and maintains any stipulated standards, for example, gradient restrictions n vertical design curve, can be used. Financing Once the formation level has been designed, the Mass-Haul Diagram can be used to indicate the most economical method of moving the earth round the project and a good estimate of the overall cost of the earth moving can be calculated. Construction The required volumes of material are known before construction begins, enabling suitable plant and machinery to be chosen, sites for spoil heaps and borrow-pits to be located and the directions of the haul to be established. Planning Ahead The Mass-Haul Diagram can be used to indicate the effect of some other engineering works, for example, tunnels and bridges, within the overall project will have on the earth moving. Such construction works upset the pattern of the Mass-Haul Diagram by restricting the directions of the haul but, since the volumes and hence the quantities of any waste and borrow will be known beforehand, hence suitable areas for spoil heaps and borrow-pits can be located in advance of construction work, enabling the work to proceed smoothly without any overlapping action Sources of Errors in Mass-Haul Diagram Some of the common sources of errors in a Mass Diagram are noted below: Approximating the end areas. Failing to apply prismoidal and curvature corrections in the computation of volume of Earthwork. Computing the areas of cross-sections beyond the limit justified by the field data. Computing the volumes beyond the nearest cubic metre. 8000 = 250 m @ IJTSRD | Unique Paper ID – IJTSRD30681 | Volume – 4 | Issue – 3 | March-April 2020 Page 767
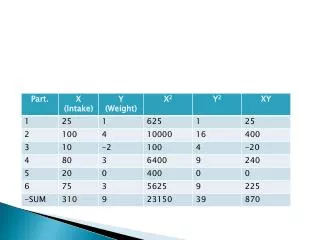
International Journal of Trend in Scientific Research and Development (IJTSRD) @ www.ijtsrd.com eISSN: 2456-6470 Common Mistakes in Mass-Haul Diagram Some of the typical mistakes often encountered in a Mass Diagram are noted below: Errors in arithmetic and approximations assumed. Using the prismoidal formula when end area volumes are sufficiently accurate. Mixing cut and fill quantities Failing to consider transition sections when passing from cut to fill, or from fill to cut. Table 1: Typical Calculation for the preparation of Mass-Haul Diagram using the predetermined data of the existing Ground Level and assumed Formation Level VOLUME (?? ) CUT ( + ) FILL ( - ) 0 - - 4.572 - 1.981 9.144 0.719 - 13.716 1.212 - 18.288 0.700 - 22.86 0.883 - 27.432 - 1.311 32.004 - 2.379 36.576 - 5.074 Σ = +3.514 m3Σ = -10.745 m3 DISTANCE (m) CUMULATIVE VOLUME (??) 0 -1.981 -1.262 -0.05 +0.65 +1.533 +0.222 -2.157 -7.231 -7.231 m3 Fig. 3: Mass-Haul Diagram drawn to its corresponding Longitudinal Profile of the existing Ground and an arbitrarily assumed Formation Level Mass Haul Diagram Using Computer Software Apart from the conventional methods of drawing a Mass- Haul Diagram by plotting graphs, several other computer softwares such as MS Excel, Autodesk CIVIL 3D have also their implications in the plotting of Mass Curves using several special in-built functions and commands. They are discussed and illustrated as follows: several special in-built functions and commands. They are discussed and illustrated as follows: @ IJTSRD | Unique Paper ID – IJTSRD30681 | Volume – 4 | Issue – 3 | March-April 2020 Page 768
International Journal of Trend in Scientific Research and Development (IJTSRD) @ www.ijtsrd.com eISSN: 2456-6470 Using MS Excel Mass-Haul Diagrams can easily be drawn in MS Excel by simply plotting the points (Chainage points on X-axis and Cumulative Volume on Y-axis) using the in-built Charts and Graphs available in it. Using Autodesk CIVIL 3D Mass-Haul Diagrams can easily be drawn in CIVIL 3D software, created by Autodesk by simply making use of the in-built functions available in it. It can also be successfully implemented in balancing the Mass Haul Volumes by shifting the base line above/ below to determine the most economically feasible one. Fig. 6: Mass-Haul Diagram by the plotting of graphs in MS Excel, which yields better accuracy in results due to the less probability of common errors/ mistakes as discussed. Fig. 4: Mass-Haul Diagram showing the general features of a Mass Curve. The portions of Cut, Fill, Waste, and Borrow have been indicated. Note that Cut and Waste are considered to be positive (+ve). On the other hand Fill and Borrow are considered to be negative (-ve) for all computations. Fig. 7: Mass-Haul Diagram plotted in Softree Optimal software which has nearly 0.01% error in plotting. Fig. 8: Mass-Haul Diagram plotted in Autodesk CIVIL 3D software which has nearly 0.001% error in plotting. Fig. 5: Mass-Haul Diagram by the manual plotting of graphs, which yields less accuracy in results due to the common errors/ mistakes as discussed. Fig. 9: Balancing of Mass Haul Volumes above and below the base line, which will help to eliminate overhaul, if any, for cost economy using Autodesk CIVIL 3D SOFTWARE. @ IJTSRD | Unique Paper ID – IJTSRD30681 | Volume – 4 | Issue – 3 | March-April 2020 Page 769
International Journal of Trend in Scientific Research and Development (IJTSRD) @ www.ijtsrd.com eISSN: 2456-6470 Table 2: Calculation of Total Cost of Earthwork Total Cost of Earthwork Free Haul prices in Free Haul distance distance x Free Haul prices Overhaul prices in Free Haul distance distance x Free Haul prices Overhaul volume x (Average Overhaul distance – Free Haul distance) x Overhaul prices Borrow prices Borrow volume x Borrow prices Waste Prices Waste volume x Waste prices Free Haul volume x Free Haul Overhaul volume x Free Haul Overhaul prices in Overhaul distance Fig. 10: Balancing the mass haul volumes in the third region by adding a dump site at station 11+50 in Autodesk CIVIL 3D CONCLUSION After the Mass-Haul Diagram has been plotted, an estimate of the total cost of the Earthwork is made as per the following equations: Haul = ???? ?????? ? ??????? ???? ???????? ??? Therefore, Total Cost of Earthwork = Free Haul prices in Free Haul distance + Overhaul prices in Free Haul distance + Overhaul prices in Overhaul distance + Borrow prices + Waste prices Thus the Earthwork computations are completed considering the cost economy of the project and ultimately the most viable alternative is chosen among the all the others for executing the process of Earthwork operations, namely, cutting, loading, hauling, and filling in the field so as to minimize the cost, effort, time, and other complications as much as possible. Therefore Mass-Haul Diagram or Mass Diagram or Mass Curve proves to be a very powerful tool as far as the economic viability of a project is concerned. Hence its proper implications will surely increase the efficiency of the execution of the works related to Earthworks in any project. References [1]Kanetkar, T. P. & Kulkarni, S. V., “Surveying & Levelling: Part 1”, Twenty Fourth Revised Edition, August 2015, Pune Vidyarthi Griha Prakashan, pp. 468-519 … [4] … [1] ???? ???? ?????? ? ??????? ???? ???? ???????? Free Haul = ??? … [2] ???????? ?????? ? (??????? ???????? ????????− ???????? ????????) ??? Overhaul = [2]Duggal, S. K., “Surveying: Volume 1”, Forth Edition, 2013, McGraw Hill Education (India) Private Limited, pp. 558-561 … [3] [3]“Balancing Mass Haul Volumes”, Exercise 2 in CIVIL 3D, Autodesk Knowledge Network @ IJTSRD | Unique Paper ID – IJTSRD30681 | Volume – 4 | Issue – 3 | March-April 2020 Page 770