Download
1 / 43
660 likes | 1.94k Vues
CE 453 Lesson 24 Earthwork and Mass Diagrams. Terrain Effects on Route Location. Earthwork is costly Attempt to minimize amount of earthwork necessary Set grade line as close as possible to natural ground level

E N D
Terrain Effects on Route Location • Earthwork is costly • Attempt to minimize amount of earthwork necessary • Set grade line as close as possible to natural ground level • Set grade line so there is a balance between excavated volume and volume of embankment http://www.agtek.com/highway.htm
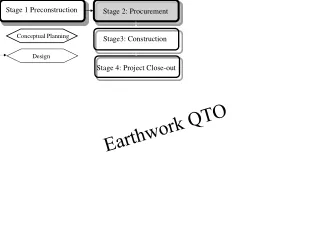
Earthwork Analysis • Take average cross-sections along the alignment (typically 50 feet) • Plot natural ground level and proposed grade profile and indicate areas of cut and fill • Calculate volume of earthwork between cross-sections
Average End Area Method • Assumes volume between two consecutive cross sections is the average of their areas multiplied by the distance between them V = L(A1 + A2)÷54 V = volume (yd3) A1 and A2 = end areas of cross-sections 1 & 2 (ft2) L = distance between cross-sections (feet)
Shrinkage • Material volume increases during excavation • Decreases during compaction • Varies with soil type and depth of fill
Swell • Excavated rock used in embankment occupies more space • May amount to 30% or more
Computing Volume (Example) Shrinkage = 10%, L = 100 ft Station 1: Cut Area = 6 ft2 Fill Area = 29 ft2 Cut Fill Ground line
Computing Volume (Example) Shrinkage = 10% Station 2: Cut Area = 29 ft2 Fill Area = 5 ft2 Cut Fill Ground line
Vcut = L (A1cut + A2cut) = 100 ft (6 ft2 + 29 ft2) = 64.8 yd3 * • 54 54 • Vfill = L (A1fill + A2fill) = 100 ft (29 ft2 + 5 ft2) = 63.0 yd3 • 54 54 • Fill for shrinkage = 63.0 * 0.1 = 6.3 yd3 • Total fill = 63.0 ft3 + 6.3 ft3 = 69.3 yd3 • Total cut and fill between stations 1 and 2 = 69.3 yd3 fill – 64.8 yd3 cut = 4.5 yd3 fill • *note: no allowance made for expansion
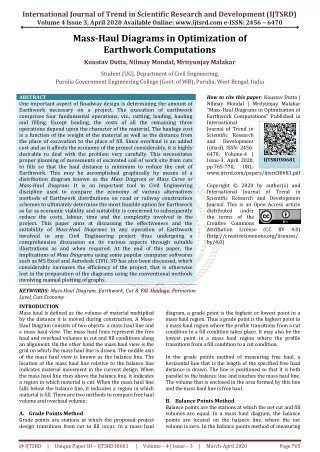
Mass Diagram • Series of lines that shows net accumulation of cut or fill between any 2 stations • Ordinate is the net accumulation of volume from an arbitrary starting point • First station is the starting point
Estimating End Area Station 1: Cut Fill Ground line
Estimating End Area Station 1: Fill Area = ∑Shapes Cut Fill Ground line
Calculate Mass Diagram Assuming Shrinkage = 25% Volumecut = 100 ft (40 ft2 + 140 ft2) = 333.3 yd3 cut 54 Volumefill = 100 ft (20 ft2 + 0 ft2) = 37.0 yd3 fill 54
Calculate Mass Diagram Assuming Shrinkage = 25% Volumefill = adjusted for shrinkage = 37.0 yd * 1.25 = 46.3 yd3
Calculate Mass Diagram Assuming Shrinkage = 25% Total cut = 333.3 yd3 - 46.3 yd3 = 287.0 yd3
Calculate Mass Diagram Assuming Shrinkage = 25% Volumecut = 100 ft (140 ft2 + 160 ft2) = 555.6 yd3 cut 54 Volumefill = 100 ft (20 ft2 + 25 ft2) = 83.3 yd3 fill 54 Volumefill = adjusted for shrinkage = 83.3 yd * 1.25 = 104.2 yd3 Total cut 1 to 2 = 555.6 yd3 – 104.2 yd3 = 451.4 yd3
Calculate Mass Diagram Assuming Shrinkage = 25% Total cut = 451.4 yd3 + 287 = 738.4 yd3
Calculate Mass Diagram Assuming Shrinkage = 25% Final Station
Station 2: net volume = 738.43 ft3 Station 1: net volume = 287.04 ft3
Station 2: net volume = 738.43 ft3 Station 3: net volume = 819.4 ft3 Station 1: net volume = 287.04 ft3
Balance point: balance of cut and fill A’ and D’ D’ and E’ N and M Etc. note: a horizontal line defines locations where net accumulation between these two balance points is zero
Locations of balanced cut and fill JK and ST ST is 5 stations long [16 + 20] – [11 + 20]
Special Terms • Free haul distance (FHD)- distance earth is moved without additional compensation • Limit of Profitable Haul (LPH) - distance beyond which it is more economical to borrow or waste than to haul from the project • Overhaul – volume of material (Y) moved X Stations beyond Freehaul, measured in sta–yd3or sta-m3 • Borrow – material purchased outside of project • Waste – excavated material not used in project
Mass Diagram Development 1) Place FHD and LPH distances in all large loops 2) Place other Balance lines to minimize cost of movement Theoretical; contractor may move dirt differently 3) Calculate borrow, waste, and overhaul in all loops 4) Identify stations where each of the above occur
Mass Diagram Example • FHD = 200 m • LPH = 725 m
Between Stations 0 + 00 and 0 + 132, cut and fill equal each other, distance is less than FHD of 200 m Note: definitely NOT to scale! Source: Wright, 1996
Between Stations 0 + 132 and 0 + 907, cut and fill equal each other, but distance is greater than either FHD of 200 m or LPH of 725 m Distance = [0 + 907] – [0 + 132] = 775 m Source: Wright, 1996
Between Stations 0 + 179 and 0 + 379, cut and fill equal each other, distance = FHD of 200 m Treated as freehaul Source: Wright, 1996
Between Stations 0 + 142 and 0 + 867, cut and fill equal each other, distance = LPH of 725 m Source: Wright, 1996
Material between Stations 0 + 132 and 0 + 42 becomes waste and material between stations 0 + 867 and 0 +907 becomes borrow Source: Wright, 1996
Between Stations 0 + 970 and 1 + 170, cut and fill equal each other, distance = FHD of 200 m Source: Wright, 1996
Between Stations 0 + 960 and 1 + 250, cut and fill equal each other, distance is less than LPH of 725 m Source: Wright, 1996
Project ends at Station 1 + 250, an additional 1200 m3 of borrow is required Source: Wright, 1996
Volume Errors • Use of Average End Area technique leads to volume errors when cross-sections taper between cut and fill sections. (prisms) • Consider Prismoidal formula
Prismoidal Formula Volume = (A1+ 4Am + A2)/6 * L Where A1 and A2 are end areas at ends of section Am = cross sectional area in middle of section, and L = length from A1 to A2 Amis based on linear measurements at the middle
Consider cone as a prism • Radius = R, height = H • End Area 1 = πR2 • End Area 2 = 0 • Radius at midpoint = R/2 • Volume =((π R2+4π(R/2)2+ 0)/ 6) * H • = (π R2/3) * H
Compare to “known” equation • Had the average end area been used the volume would have been • V = ((π R2) + 0)/2 * L (or H) • Which Value is correct?
Class application • Try the prismoidal formula to estimate the volume of a sphere with a radius of zero at each end of the section length, and a Radius R in the middle. • How does that formula compare to the “known” equation for volume? • What would the Average End area estimate be?