Download
1 / 9
90 likes | 113 Vues
In Casting process filling and solidification is difficult to visualize by experimental methods. The fluid flow, phase transfer, temperature distribution and velocity gradient is undesirable. So we are going to CFD software to control the solidification parameters. According to finite element theory, using FLUENT software and three dimensional model to simulate liquid metal free surface and temperature field of casting filling process numerically. Boundary and initial conditions, such as velocity, pressure, temperature, etc., was reasonably calculated by theoretically. The feasibility of using FLUENT to simulate three dimensional casting was studied the fluctuation of molten metal free surface was observed. The temperature distribution data on the end of filling was recorded, for further numerical simulation of casting solidification process which provided an accurate initial condition. Rajiv Kumar N | Umar Ahamed P | Mohamed Anwar A U "CFD Analysis of Fluid Flow in Sand Casting" Published in International Journal of Trend in Scientific Research and Development (ijtsrd), ISSN: 2456-6470, Volume-3 | Issue-2 , February 2019, URL: https://www.ijtsrd.com/papers/ijtsrd21553.pdf Paper URL: https://www.ijtsrd.com/engineering/mechanical-engineering/21553/cfd-analysis-of-fluid-flow-in-sand-casting/rajiv-kumar-n<br>

E N D
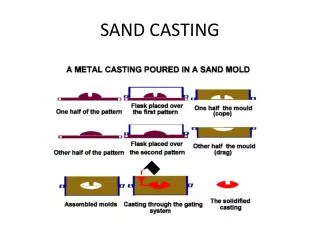
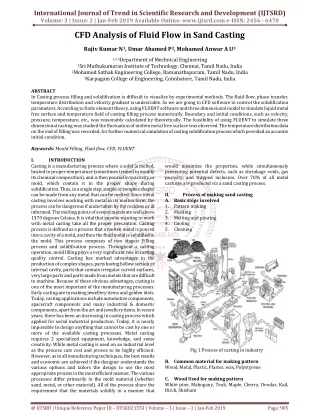
International Journal of Trend in Scientific Research and Development (IJTSRD) Volume: 3 | Issue: 2 | Jan-Feb 2019 Available Online: www.ijtsrd.com e-ISSN: 2456 - 6470 CFD Analysis of Fluid Flow in Sand Casting Rajiv Kumar N1, Umar Ahamed P2, Mohamed Anwar A U3 1,2,3Department of Mechnical Engineering 1Sri Muthukumaran Institute of Technology, Chennai,Tamil Nadu, India 2Mohamed Sathak Engineering College, Ramanathapuram,Tamil Nadu, India 3Karpagam College of Engineering, Coimbatore,Tamil Nadu, India ABSTRACT In Casting process filling and solidification is difficult to visualize by experimental methods. The fluid flow, phase transfer, temperature distribution and velocity gradient is undesirable. So we are going to CFD software to control the solidification parameters. According to finite element theory, using FLUENT software and three dimensional model to simulate liquid metal free surface and temperature field of casting filling process numerically. Boundary and initial conditions, such as velocity, pressure, temperature, etc., was reasonably calculated by theoretically. The feasibility of using FLUENT to simulate three dimensional casting was studied the fluctuation of molten metal free surface was observed. The temperature distribution data on the end of filling was recorded, for further numerical simulation of casting solidification process which provided an accurate initial condition. Keywords: Mould Filling, Fluid flow, CFD, FLUENT I. INTRODUCTION Casting is a manufacturing process where a solid is melted, heated to proper temperature (sometimes treated to modify its chemical composition), and is then poured in to a cavity or mold, which contain it in the proper shape during solidification. Thus, in a single step, simple or complex shapes can be made from any metal that can be melted. Since metal casting involves working with metal in its molten form, the process can be dangerous if undertaken by the reckless or ill informed. The melting points of several metals are well above 1370 degrees Celsius. It is vital that anyone wanting to work with metal casting take all the proper precaution. Casting process is defined as a process that a molten metal is poured into a cavity of a mold, and then the fluid metal is solidified in the mold. This process composes of two stages: Filling process and solidification process. Throughout a casting operation, mold filling plays a very significant role in casting quality control. Casting has marked advantages in the production of complex shapes, parts having hollow section or internal cavity, parts that contain irregular curved surfaces, very large parts and parts made from metals that are difficult to machine. Because of these obvious advantages, casting is one of the most important of the manufacturing processes. Early casting are in making jewellery items and golden idols. Today, casting applications include automotive components, spacecraft components and many industrial & domestic components, apart from the art and jewellery items. In recent years, there has been an increasing in casting process which applied for serial industrial production. Today, it is nearly impossible to design anything that cannot be cast by one or more of the available casting processes. Metal casting requires 2 specialized equipment, knowledge, and some creativity. While metal casting is used on an industrial level as the process cuts cost and proves to be highly efficient. However, as in all manufacturing techniques, the best results and economic are achieved if the designer understands the various options and tailors the design to use the most appropriate process in the most efficient manner. The various processes differ primarily in the mold material (whether sand, metal, or other material). All of the process share the requirement that the materials solidify in a manner that would maximize the properties, while simultaneously preventing potential defects, such as shrinkage voids, gas porosity, and trapped inclusion. Over 70% of all metal castings are produced via a sand casting process. II. Process of making sand casting A.Basic steps involved 1.Pattern making 2.Molding 3.Melting and pouring 4.Cooling 5.Cleaning Fig 1 Process of casting in industry B.Common material for making pattern Wood, Metal, Plastic, Plaster, wax, Polystyrene C.Wood Used for making pattern White pine, Mahogany, Teak, Maple, Cherry, Deodar, Kail, Birch, Shisham @ IJTSRD | Unique Reference Paper ID – IJTSRD21553 | Volume – 3 | Issue – 2 | Jan-Feb 2019 Page: 905
International Journal of Trend in Scientific Research and Development (IJTSRD) @ www.ijtsrd.com eISSN: 2456-6470 III. A.Flange Design specifications of the flange is specified in fig 2. This represents the 2D View of the flange. Design specifications C.Gating system Turbulence can be avoided by incorporating small changes in the design of gating system. The Sharp changes in the flow should be avoided & making smooth change. The gating system must be designed always full with liquid metal. OBJECTIVES OF GATING SYSTEM: 1.Clean molten metal. 2.Smooth filling of the casting cavity. 3.Uniform filling of the casting cavity. 4.Complete filling of the casting cavity. 5.The mold cavity must be filled with a clean metal so that it prevents the entry of slag and inclusions into the mold cavity, which in turn minimizes the surface instability. 6.If the mold has smooth filling then it helps to reduce the bulk turbulence. If it has a uniform filling it means that the casting fill is in a controlled manner. Complete filling of the cavity makes the metal thin with minimum resistance at the end sections. Commonly Preferred Gating System from Industries is BOTTOM GATINGSYSTEM. In bottom gating molten metal enters from the bottom of the casting cavity. It is recommended for tall casting where free fall of molten metal has to be avoided. The advantage of the bottom gating is that molten metal enters the bottom of the cavity gradually with minimal disturbances. The only disadvantage is that casting cavity is filled with variable filling rate, having high velocity of molten metal at the start of filling and gradually decreasing velocity as the molten metal fills the cavity. DESIGN CONSIDERATION OF BOTTOM GATED SYSTEM: 1.Air forced up and out of mold. 2.Reduced splashing and oxidation. 3.As metal is poured the system, effective head reduced. D.Design specification of flange Figure 5 explains about the design specifications of the flange which states the 2D View of bottom gated system of flange. Fig 2 2D View of flange Length of the flange = 108mm Width of the flange= 33mm Outer diameter of the flange= 63mm Inner diameter of the flange= 38mm Fig 3 illuminates the real object (flange). Fig 3 Real object B.Pulley Design specifications of the pulley is specified in fig 4. This represents the 2D View of the pulley. Fig 4 2D View of pulley Diameter of A pulley=110mm Diameter of B pulley=93mm Diameter of C pulley=72mm Height of A pulley=18.5mm Height of B pulley=10mm Height of C pulley=13.5mm Fig 5 2D View of bottom gated system of flange Total length of the pouring=100mm Maximum diameter of the pouring=62mm Minimum diameter of the pouring=25mm Length of the gate=35mm Height of the gate=10mm Thickness of the gate=10mm @ IJTSRD | Unique Reference Paper ID – IJTSRD21553 | Volume – 3 | Issue – 2 | Jan-Feb 2019 Page: 906
International Journal of Trend in Scientific Research and Development (IJTSRD) @ www.ijtsrd.com eISSN: 2456-6470 Figure 6 & 7 illustrates the gating system for flange and the mould cavity of gating system for flange. E.Design specification of pouring and sprue 1.Sprue wells are built with a different material than the one used in the mold for higher resistance to erosion 2.In the case of deep molds, the sprue may be offset at several points rather than using a straight sprue. The two dimensional and three dimensional views of pouring & sprue are shown in figure 10. Fig 6 Gating system for flange Fig 10 2D & 3D View of pouring & sprue Total length of the pouring=100mm Maximum diameter of pouring=62mm Minimum diameter of pouring=25mm Real view of pouring and sprue is clearly explained in figure 11. Fig 7 Mould cavity of Gating system for flange DESIGN SPECIFICATION OF PULLEY: Total length of the pouring=100mm Maximum diameter of the pouring=62mm Minimum diameter of the pouring=25mm Length of the gate=35mm Height of the gate=8mm Thickness of the gate=8mm Figure 8 & 9 illustrates the gating system for pulley and the mould cavity of gating system for pulley. Fig 11 Real view of pouring and sprue F.Design consideration and specifications of riser 1.The ratio (Volume / surface area)2 of the Riser must be greater than that of the casting. 2.However, when this condition does not meet the metal in the riser can be kept in liquid state, by heating it externally or using exothermic materials in it. 3.The way the riser is connected to the casting is very important, the connection called neck. So, it solidify first, so that the shrinkage cavity is located in the riser itself. The removal of the riser should be made simpler making the neck smaller. Figure 12 illustrates about the two dimensional and three dimensional view of riser for flange. Fig 8 Gating system of pulley Fig 9 Mould cavity of gating system for pulley Fig 12 2D & 3D View of riser for flange @ IJTSRD | Unique Reference Paper ID – IJTSRD21553 | Volume – 3 | Issue – 2 | Jan-Feb 2019 Page: 907
International Journal of Trend in Scientific Research and Development (IJTSRD) @ www.ijtsrd.com eISSN: 2456-6470 Length of riser for flange=10mm Height of the riser for flange=67mm The two dimensional and three dimensional view of riser for pulley is shown in figure13 The casted product has been shown in figure 15. Fig 15 Casted product V. THERMOPHYSICAL PROPERTIES OF GREY CAST IRON: Density (ρ) = 7.06x10³ – 7.34x10³ kg/m3 Specific heat capacity = 490J/kg k Modulus of Elasticity = 124 Gpa Thermal expansion = 9x10⁻⁶ °C Thermal conductivity = 53.3 w/m k Electric resistivity = 1.1 x 10⁻⁷ ohm Tensile strength = 276 MPa Elongation = 1% Shear strength = 400 MPa Compressive yield strength = Min 827 Mpa Fatigue strength = 138 Mpa CALCULATIONS FOR FLANGE: Height of sprue (ht) Height of mold filling (h) Total height of the mold (hm) = 33mm VELOCITY OF GATE: Vg = √2g (ht –h) Vg = √2 x 9.81 (100x10-3 – 10x10-3) Vg = 1.32 m/s GATE CROSS-SECTIONAL AREA (Ag): Ag = l × b = (35×10-3 × 10×10-3) Ag = 3.5×10⁻⁴m2 FLOW RATE OF METAL DELIVERED BY GATE TO MOLD: Qg = Ag x Vg Qg = 3.5x10-4 X 1.32 Qg = 4.62x10⁻⁴ m3/s MOULD FILLING TIME (tf): tf = 2 Am [√ht – (√(ht - hm))] / Ag √2g tf = 0.677 s BERNOULLI’S EQUATION: P0 + (ρV0/2) + ρgh0 = P0 + (ρvm2/2) + ρgh1 + f (1x10⁵) + (7000x0/2) + (7200x9.81x1) = (1x10⁵) + (7200xvm2 / 2) + (7200x9.81x0) + 0 Vm = 1.4 m/s CALCULATIONS FOR PULLEY: Height of the sprue (ht) Height of mold filling (h) Total height of the mold (hm) = 42mm CALCULATIONS Fig 13 2D & 3D view of riser for pulley Length of riser for pulley=10mm Height of riser for pulley=51mm IV. MATERIAL SPECIFICATIONS Material – Grey cast iron AVERAGE COMPOSITION OF CAST IRON: Carbon Silicon Manganese Magnesium Sulphur Properties of cast iron: A number of properties such as mechanical, physical and service properties are of important in assessing materials suitably for any application. The mechanical properties of interest are tensile strength proof stress, elongation, hardness, impact strength, elastic modulus, and fatigue strength, notch sensitivity while the physical properties of interest are damping capacity, machinability and conductivity. The service properties generally involved are wear resistance, heat resistance, corrosion resistance. FILLING AND FEEDING SYSTEM: Molten metal is filled into the molding cavity from pouring series of filling channels which is called filling/runner system. Feeding is the process after filling up of liquid metal till to freezing of metals. Both of them are curtail for getting good quality of castings. A proper designed runner system can eliminate generation of casting defects such as porosity, inclusion, etc. and feeding mechanism is mainly to deal with shrinkage problems. Figure 14 explains briefly about the filling and feeding system used for this purpose. -3.0 -1.8 -0.1 -0.01 -4.0% -2.8% -1.00% -0.10% = 100mm = 10mm -0.03% max = 100mm = 8mm Fig 14 Filling and feeding system @ IJTSRD | Unique Reference Paper ID – IJTSRD21553 | Volume – 3 | Issue – 2 | Jan-Feb 2019 Page: 908
International Journal of Trend in Scientific Research and Development (IJTSRD) @ www.ijtsrd.com eISSN: 2456-6470 VELOCITY OF GATE: Vg = √2g (ht –h) Vg = √2 x 9.81 (100x10-3 – 8x10⁻³) Vg = 1.8 m/s GATE CROSS-SECTIONAL AREA (Ag): Ag = l × b = (35×10-3 × 8×10-3) Ag = 2.4×10⁻⁴m2 FLOW RATE OF METAL DELIVERED BY GATE TO MOLD: Qg = Ag x Vg Qg = 2.4x10-4 X 1.8 Qg = 5.04x10⁻⁴ m3/s MOULD FILLING TIME (tf): tf = 2 Am [√ht – (√(ht - hm))] / Ag √2g tf BERNOULLI’S EQUATION: P0 + (ρV0/2) + ρgh0 = P0 + (ρvm2/2) + ρgh1 + f (1x10⁵) + (7000x0/2) + (7200x9.81x0.11) = (1x10⁵) + (7200xvm2 / 2) + (7200x9.81x0) + 0 Vm = 1.46 m/s VI. CFD Analysis Process The general process for performing a CFD analysis is outlined below so as to provide a reference for understanding the various aspects of a CFD simulation. The process includes: 1.Formulate the Flow Problem 2.Model Geometry and Flow Domain 3.Establish the Boundary and Initial conditions 4.Generate the Grid 5.Establish the Simulation Strategy 6.Establish the Input parameters and Files 7.Perform the Simulation 8.Monitor the Simulation for Completion 9.Post-process the Simulation to get the Result 10.Make the comparison of the result 11.Repeat the process to examine the sensitivities 12.Document FORMULATE THE FLOW PROBLEM: The first step of the analysis process is to formulate the flow problem by seeking answers to the following questions: ?What is the objective of the analysis? ?What is the easiest way to obtain those objectives? ?What geometry should be included? ?What are the free stream and/or operating condition? ?What dimensionality of the spatial model is required? (1D, quasi-1D, 2D, axisymmetric, 3D) ?What should the flow domain look like? ?What temporal modeling is appropriate? (steady or unsteady) ?What is the nature of the viscous flow? (inviscid, laminar, turbulent) ?How should the gas be modeled? MODEL THE GEOMETRY AND FLOW DOMAIN: The body about which flow is to be analyzed requires modeling. This generally involves modeling the geometry with a CAD software package. Approximation of the geometry and simplification may be required to allow an analysis with reasonable effort. Concurrently, decisions are made as to the extent of the finite flow domain in which the flow is to be simulated. Portions of the boundary of the flow domain coincide with the surfaces of the body geometry. Other surfaces are free boundaries over which flow enters or leaves. ESTABLISH THE BOUNDARY AND INITIAL CONDITIONS: Since a finite flow domain is specified, physical condition are required on the boundary of the domain. The simulation generally starts from an initial solution and uses an iterative method to reach a final flow field solution. GENERATE THE GRID: The flow domain is discretized into a grid. The grid generation involves defining the structure and topology and then generating a grid on that topology. Currently all cases involve multi-block, structured grids; the grid blocks may be abbuting, contiguous, non-contiguous, and over lapping. The grid should exhibit some minimal grid quality as defined by measures of orthogonality (especially at the boundaries), relative grid spacing (15% to 20% stretching is considered a maximum value), grid skewness, etc… further the maximum spacing should be consistence with the desired resolution of important features. The resolution of boundary layers requires the grid clustered in the direction normal to the laminar sub-layer of the boundary layer. For turbulent flows, the first point off the wall should exhibit a y+ value of less than 1.0. ESTABLISH THE SIMULATION STRATEGY: The strategy for performing the simulation involves determining such things as the use of space-marching, the choice of turbulence or chemistry model, and the choice algorithms. ESTABLISH THE INPUT PARAMETERS AND FILES: A CFD codes generally requires that an input data file be created listing the values of the input parameters consisted with the desired strategy. Further the grid file containing the grid boundary condition information is generally required. The files for the grid and initial flow solution need to be generated. PERFORM THE SIMULATION: The simulation is performed with various possible with options for interactive or batch processing and distributed processing. MONITOR THE SIMULATION FOR COMPLETION: As the simulation proceeds, the solution is monitored to determine if a “converged” solution has been obtained, which iterative convergence is. Further discussion can be found on the page entitled examining iterative convergence. POST-PROCESS: Post-processing involves extracting the desired flow properties (thrust, lift, drag, etc…) from the computed flow field. COMPARISONS OF THE RESULT: The computed flow properties are then compared to results from analytic, computational, or experimental studies to establish the validity of the computed results. = 1.13 s @ IJTSRD | Unique Reference Paper ID – IJTSRD21553 | Volume – 3 | Issue – 2 | Jan-Feb 2019 Page: 909
International Journal of Trend in Scientific Research and Development (IJTSRD) @ www.ijtsrd.com eISSN: 2456-6470 ?Liquid metal begins to flow smoothly in to the bottom of die cavity from centre after 0.003s. ?Liquid metal flows in the die cavity the first contact with bottom of the cavity. When the flow of liquid metal begins to flow back to the middle part of the die cavity. From the wall of pouring basin bottom of the cavity will be filled with mold metal in 0.1s or and the top along cavity of walls being to be casted. However, the floe state of liquid metal is still unstable at this moment. ?At 0.3s the liquid metal is filled in the outer surface of the die cavity of air and turbulence flow is interface. ?At 0.55s the flow of liquid goes in to a stable state of given figure level of liquid is rises slowly. On the position of liquid metal is touches the inlet of riser. ?Liquid metal reaches the top of the model. All elements of the top are fill of liquid metal at 0.76s filling process is completed. ?The change of free surface in giving fig.3 show that in the early stage of the filling process the liquid level is volatile, especially when liquid metal first contact with the wall of mold. At this point the flow of liquid metal belongs to strong turbulent flow. It is prone to generate blowhole, slag inclusion and other casting defects in this stage. When filling process reach to 0.55 seconds or so, filling enters the stable stage and the speed slower, liquid surface hasn’t obvious fluctuation, liquid metal simultaneously and slowly cast to top along cavity of four walls until end of the filling. REPEAT THE PROCESS TO EXAMINE SENSITIVITIES: The sensitivity of the computed results should be examined to understand the possible differences in the accuracy of results and / or performance of the computation with respect to search things as: dimensionality, flow condition, initial condition, marching strategy, algorithms, grid topology and density, turbulence model, chemistry model, flux model, artificial viscosity, boundary condition, computer system. DOCUMENT: Documenting the findings of an analysis involves describing each of these steps in the process. PROCEDURE FOR MODELLING AND MESHING BY ICM CFD14.5: 1.Select operation- geometry-volume-square 2.Give the dimension value 3.Create the model 4.Create the outlet header and save the model 5.Give boundary condition 6.Unite all the volumes using the volume 7.Select zone boundary condition 8.Mess the all volumes after giving the boundary condition 9.Model and meshing is complete- model is too be exported to the FLUENT for analysis PROCEDURE FOR ANALYSIS BY FLUENT: 1.Click the fluent icon select 3ddp 2.Read the mesh file 3.Wait for the file to get load 4.Select grid than check 5.Check the mesh size 6.Converting the dimensions m to mm 7.Select define –model–viscous-select k-epsilon then click ok 8.Select the type of fluid copy the data and past 9.Select define-boundary condition-type of fluid-inlet velocity-outlet pressure 10.Next select solve-controls-solutions 11.Select solve-initialize-initialize-then select unit 12.Select-monitors-residual-plot-increase absolute value 13.File-write-auto save-for every 100 iteration 14.Now select –solve –iterate 15.Particular iteration the result are taken VII. Simulation and Results SIMULATION OF FLANGE: In this simulation of casting filling process, multiphase flow (VOF), energy, turbulence and solidification options were chosen. Also, reasonable numerical simulation formula was chosen. Liquid surface tension was controlled. Casting, mold material properties and calculation boundary conditions were applied. The whole calculation domain state was initialized. Flow field and temperature field were coupling simulated. The time of 3D model of cell body finished filling process consisting with actual production of filling were obtained after using FLUENT simulation. FREE SURFACE OF FILLING PROCESS: In the whole simulation of casting filling process, the flow of molten metal can be divided into five parts. ?Liquid metal enters from gate entrance liquid surface rises steadily in the gate liquid metal fills the whole gate at 0.003s a)0.02 sec b) 0.1sec c) 0.15sec Fig 16 Initial stages of phase transfer d) 0.2sec e) 0.3sec f) 0.4sec @ IJTSRD | Unique Reference Paper ID – IJTSRD21553 | Volume – 3 | Issue – 2 | Jan-Feb 2019 Page: 910
International Journal of Trend in Scientific Research and Development (IJTSRD) @ www.ijtsrd.com eISSN: 2456-6470 bottom of the cavity, the transfer direction of velocity is in keeping with flow direction of liquid metal. g) 0.55sec Fig 17 Final stages of phase transfer h) 0.63sec The initial and final stages of phase transfer has been described in figure 16 and 17. Finally the mould filling of flange is illustrated in figure 18. Fig 20 velocity vector for flange SIMULATION OF PULLEY: In this simulation of casting filling process, multiphase flow (VOF), energy, turbulence and solidification options were chosen. Also, reasonable numerical simulation formula was chosen. Liquid surface tension was controlled. Casting, mold material properties and calculation boundary conditions were applied. The whole calculation domain state was initialized. Flow field and temperature field were coupling simulated. The time of 3D model of cell body finished filling process consisting with actual production of filling were obtained after using FLUENT simulation. FREE SURFACE OF FILLING PROCESS: In the whole simulation of casting filling process, the flow of molten metal can be divided into five parts. ?Liquid metal enters from gate entrance liquid surface rises steadily in the gate liquid metal fills the whole gate at 0.02s ?Liquid metal begins to flow smoothly in to the bottom of die cavity from centre after 0.02sec ?Liquid metal flows in the die cavity the first contact with bottom of the cavity. When the flow of liquid metal begins to flow back to the middle part of the die cavity. From the wall of pouring basin bottom of the cavity will be filled with mold metal in 0.2s or so and the top along cavity of walls being to be casted. However, the flow state of liquid metal is still unstable at this moment. ?At 045.s the liquid metal is filled in the outer surface of the die cavity of air and turbulence flow is interface. ?At 1.35s the flow of liquid goes in to a stable state of given figure level of liquid is rises slowly. On the position of liquid metal is touches inlet of riser. ?Liquid metal reaches the top of the model. All elements of the top are fill of liquid metal at 1.49s filling process is completed. The change of free surface in figure 21 shows that in the early stage of the filling process the liquid level is volatile, especially when liquid metal first contact with the wall of mold. At this point the flow of liquid metal belongs to strong turbulent flow. It is prone to generate blowhole, slag inclusion and other casting defects in this stage. When filling process reach to 0.55 seconds or so, filling enters the stable stage and the speed slower, liquid surface hasn’t obvious fluctuation, liquid metal simultaneously and slowly cast to top along cavity of four walls until end of the filling. Fig 18 Mould filling of flange TEMPERATURE FIELD OF FILLING PROCESS OF FLANGE: The change of temperature field in filling process. It can be found that, after liquid metal has entered the bottom of cavity, the transfer direction of temperature is in keeping with flow direction of liquid metal and they are all transferred placidly from center to all around, When temperature has passed to the wall, transfer speed of temperature of a, b wall is faster than c. The warming rate at the intersection of two walls is faster than other locations of model. When observed comprehensively, the temperature changes intensively in during the seconds of the whole filling process, with the filling process gradually becoming stable. Temperature changes will also become stable. According to previous research, this simulation result conforms to actual situation because the fluid is the carrier of temperature and the change of temperature field is decided by the change of flow field. Figure 19 explains the temperature distribution of flange. Fig 19 Temperature distribution of flange VELOCITY VECTOR OF FLANGE: Figure 20 shows the change of velocity field in filling process. It can be found that, after liquid metal has entered in the @ IJTSRD | Unique Reference Paper ID – IJTSRD21553 | Volume – 3 | Issue – 2 | Jan-Feb 2019 Page: 911
International Journal of Trend in Scientific Research and Development (IJTSRD) @ www.ijtsrd.com eISSN: 2456-6470 TEMPERATURE FIELD OF FILLING PROCESS OF PULLEY: Figure 24 shows the change of temperature field in filling process. It can be found that, after liquid metal has entered the bottom of cavity, the transfer direction of temperature is in keeping with flow direction of liquid metal and they are all transferred placidly from center to all around, When temperature has passed to the wall, transfer speed of temperature of a, b wall is faster than c. The warming rate at the intersection of two walls is faster than other locations of model. When observed comprehensively, the temperature changes intensively in during the seconds of the whole filling process, with the filling process gradually becoming stable. Temperature changes will also become stable. According to previous research, this simulation result conforms to actual situation because the fluid is the carrier of temperature and the change of temperature field is decided by the change of flow field. a) 0.02sec b)0.1sec c)0.2sec Fig 21 Initial stages of phase transfer d)0.45sec Fig 24 Temperature distribution of pulley VELOCITY VECTOR OF PULLEY: Figure 25 shows the change of velocity field in filling process. It can be found that, after liquid metal has entered in the bottom of the cavity, the transfer direction of velocity is in keeping with flow direction of liquid metal. e)0.65sec f)0.77sec Fig 25 Velocity vector of pulley VIII. COMPARISION: Comparisons and conclusion g)1.09sec Fig 22 Final stages of phase transfer Figure 23 shows the mould filling of pulley. h)1.35sec TABLE I. Method Experimental- Casting CFD analysis COMPARISON - PULLEY Time tt (sec) 1.13 1.49 TABLE II. Method Experimental- Casting CFD analysis COMPARISON -FLANGE Time tt (sec) 0.67 0.76 Comparison between experimental and CFD simulation of flange and pulley is done. On that comparison tells that experimental value of mould filling is slightly less than of CFD simulation. Fig 23 Mould filling of pulley @ IJTSRD | Unique Reference Paper ID – IJTSRD21553 | Volume – 3 | Issue – 2 | Jan-Feb 2019 Page: 912
International Journal of Trend in Scientific Research and Development (IJTSRD) @ www.ijtsrd.com eISSN: 2456-6470 [4]Carlos E. Esparza, Martha P. Guerrero-Mata Roger Z. Rios-Mercado (2005) ‘Optimal Design Of Gating System By Gradient Search Mode’ Computational Materials Science. CONCLUSIONS: According to the Flange and Pulley simulation for flow field and temperature field of 3D model in casting filling process, visual simulation of casting process can be made well, especially for the accuracy and the visibility of the change of liquid metal free surface by using FLUENT solver in common software ANSYS. Due to the fluid is the carrier of temperature, the change of temperature field is decided by the change of flow field. The results of FLUENT simulation show that, solidification process and flow distribution identification of velocity vector in the early stage of filling process, the liquid level is volatile, especially when Liquid metal first contact with the wall of mold. It is possible to generate blowhole, slag inclusion and other casting defects in this stage. After filling enters the stable stage, the speed slows down and liquid level rises reposefully. The probability of defects caused by strong turbulent is decreased. Comparisons between experimental and simulation has been done. Overall experimental and simulation tell us about the fluid flow, temperature distribution and velocity vectors are identified. This identification shows to control the mould filling process. References [1] Nitin Pathak, Arvind Kumar, Anil Yadav, Pradip Dutta (2009) ‘Effects of mould filling on evolution of the solid–liquid interface during solidification’ Applied Thermal Engineering. [5]Vivek S.Gondkar, K . H. Inamdar (2014) ‘Optimization of Casting Process Parameters through Simulation’ Department of Mechanical Engineering. [6]Leszek Sowa (2012) ‘Mathematical Modeling of the Filling Process of A Slender Mould Cavity’ Scientific Research of the Institute of Mathematics and Computer Science. [7]C. R. Swaminathan, V. R. Voller, A time-implicit filling algorithm, Applied Mathematical Modelling 18 (1994) 101–108. [8]W.D. Bennon, F. P. Incropera, A continuum Model for momentum, heat and species transport in binary solid– liquid phase change systems–I Model formulation, International Journal of Heat and Mass Transfer 30 (1987). [9]I. Im, W. Kim, K. Lee, A unified analysis of filling and solidification in casting with natural convection, International Journal of Heat and Mass Transfer 44 (2001) 1507–1515. [10]Y. C. Lee, H. Y. Hwang, J. K. Choi, 2000, A study on application of solidification and fluid flow simulation to die design in gravity die casting, in: P. R. Sahm, P. N. Hansen, J.G. Conley (eds.), Modelling of Casting, Welding and Advanced Solidification Process IX, Aachen, Germany, pp. 349–356. [2]YUWEN Xuan-xuan, CHEN Ling, HAN Yi-jie (2012) ‘Numerical Simulation of Casting Filling Process Based on FLUENT’ International Conference on Future Electrical Power and Energy Systems. [11]Fluent 6.3.26 Documentation – User’s Guide and UDF Manual, Lebanon, USA, 2005 [3]Dang-Kha Nguyen, Shyh –Chour Huang (2012) ‘Analysis The Effect Of Turbulence Flow, The Heat, And Phase Transfer On Thermal Arrest Time In Casting Process By Computational Fluid Dynamics’ Journal Of Fluid Engineering. [12]S. V. Patankar, Numerical Heat Transfer and Fluid Flow, Hemisphere, Washington, DC, 1980. @ IJTSRD | Unique Reference Paper ID – IJTSRD21553 | Volume – 3 | Issue – 2 | Jan-Feb 2019 Page: 913