Download
1 / 4
40 likes | 56 Vues
This work aims, through a theoretical study, to make a comparison of three different parallel vertical junction solar cells photovoltages Si silicon, InAs indium arsenide and GaAs gallium arsenide . For this we have showed the evolution of these voltages with regard to temperature and the collection of the charge carrier velocity. The photovoltaic cell having the voltage most important is probably more performant.These cells have the same dimensions, are doped with the same doping level and are used under the same conditions of illumination and temperature. The comparative study is made only on their electric photovoltage. This important size for the characterization of cell performance is deduced from the continuity equation resolution. The photovoltages are studied according to the temperature and according to charge carrier's collection velocity. Dieme Nf. | Sane M. | Honadia P. Ab. Aziz | Barro F. Id. "Comparative Study of Parallel Vertical Junction Solar Cell Photovoltages" Published in International Journal of Trend in Scientific Research and Development (ijtsrd), ISSN: 2456-6470, Volume-3 | Issue-6 , October 2019, URL: https://www.ijtsrd.com/papers/ijtsrd29193.pdf Paper URL: https://www.ijtsrd.com/engineering/chassis-engineering/29193/comparative-study-of-parallel-vertical-junction-solar-cell-photovoltages/dieme-nf<br>

E N D
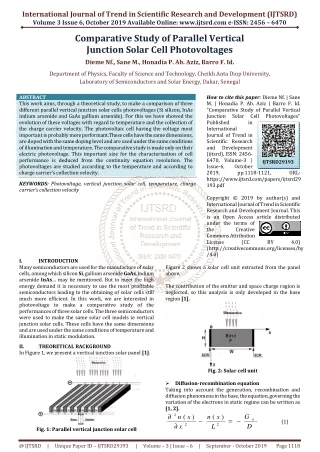
International Journal of Trend in Scientific Research and Development (IJTSRD) Volume 3 Issue 6, October 2019 Available Online: www.ijtsrd.com e-ISSN: 2456 – 6470 Comparative Study of Parallel Vertical Junction Solar Cell Photovoltages Dieme Nf., Sane M., Honadia P. Ab. Aziz, Barro F. Id. Department of Physics, Faculty of Science and Technology, Cheikh Anta Diop University, Laboratory of Semiconductors and Solar Energy, Dakar, Senegal ABSTRACT This work aims, through a theoretical study, to make a comparison of three different parallel vertical junction solar cells photovoltages (Si silicon, InAs indium arsenide and GaAs gallium arsenide). For this we have showed the evolution of these voltages with regard to temperature and the collection of the charge carrier velocity. The photovoltaic cell having the voltage most important is probably more performant.These cells have the same dimensions, are doped with the same doping level and are used under the same conditions of illumination and temperature. The comparative study is made only on their electric photovoltage. This important size for the characterization of cell performance is deduced from the continuity equation resolution. The photovoltages are studied according to the temperature and according to charge carrier’s collection velocity. KEYWORDS: Photovoltage, vertical junction solar cell, temperature, charge carrier’s collection velocity How to cite this paper: Dieme Nf. | Sane M. | Honadia P. Ab. Aziz | Barro F. Id. "Comparative Study of Parallel Vertical Junction Solar Cell Published in International Journal of Trend in Scientific Research and Development (ijtsrd), ISSN: 2456- 6470, Volume-3 | Issue-6, October 2019, pp.1118-1121, https://www.ijtsrd.com/papers/ijtsrd29 193.pdf Copyright © 2019 by author(s) and International Journal of Trend in Scientific Research and Development Journal. This is an Open Access article distributed under the terms of the Creative Commons Attribution License (CC (http://creativecommons.org/licenses/by /4.0) Photovoltages" IJTSRD29193 URL: BY 4.0) I. Many semiconductors are used for the manufacture of solar cells, among which silicon Si, gallium arsenide GaAs, Indium arsenide InAs… may be mentioned. But to meet the high energy demand it is necessary to use the most profitable semiconductors leading to the obtaining of solar cells still much more efficient. In this work, we are interested in photovoltage to make a comparative study of the performances of three solar cells. The three semiconductors were used to make the same solar cell models ie vertical junction solar cells. These cells have the same dimensions and are used under the same conditions of temperature and illumination in static modulation. II. THEORETICAL BACKGROUND In Figure 1, we present a vertical junction solar panel [1]. INTRODUCTION Figure 2 shows a solar cell unit extracted from the panel above. The contribution of the emitter and space charge region is neglected, so this analysis is only developed in the base region [1]. Fig. 2: Solar cell unit ?Diffusion-recombination equation Taking into account the generation, recombination and diffusion phenomena in the base, the equation, governing the variation of the electrons in static regime can be written as [1, 2]. x n x ∂ ∂ 2 G ( ) ( ) n x − = − n (1) 2 2 D L Fig. 1: Parallel vertical junction solar cell @ IJTSRD | Unique Paper ID – IJTSRD29193 | Volume – 3 | Issue – 6 | September - October 2019 Page 1118
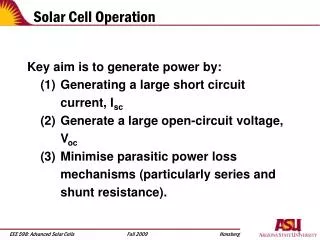
International Journal of Trend in Scientific Research and Development (IJTSRD) @ www.ijtsrd.com eISSN: 2456-6470 n(x) and L are respectively the electrons density, diffusion length. D is the diffusion constant and μ the mobility [3, 4] K D . . µ = with q the elementary charge, k the Boltzmann constant and T the temperature. Gn= g(z)+gth is the carrier generation rate. g(z) is the carrier generation rate at the thickness z in the base and can be written as: biz ie a z g ∑ ) ( ai and bi are obtained from the tabulated values of AM1.5 solar illumination spectrum and the dependence of the absorption coefficient of silicon with illumination wavelength. gth is the thermal generation rate. But in the absence of temperature gradient gth is uniformity compensated by the thermal recombination rate [4, 5] It is given by: 2 .i th n c g = with 3 Eg T A n n ni refers to the intrinsic concentration of minority carriers in the base, An is a specific constant of the material, Eg is the energy gap NB is the base doping concentration in impurity atoms and C is the proportionality coefficient and τ lifetime 1 = τ (4) (2) T q i= . . exp( ) 2 (5) 2 KT − = (3) (6) C. N B The energy gap is given by: 2 . a T + = − Eg Eg (7) 0 b T semiconductor µ µ µ µ (cm2/Vs) Eg0 (eV) Si InAs GaAs a(eV/K) b (K) 4.73.10-4 2.3.10-4 5.4.10-4 An 1350 44000 8500 1.17 0.43 1.52 636 - 4,3 204 3.87.1016 1.68.1014 5.09.1014 ?Electrons density The solution of equation (1) is: x x = + + ( ) sinh( ) cosh( ) n x A B L L (8) 2 a L Eg ∑ Coefficients A and B are determined through the following boundary conditions Boundary conditions: ?at the junction (x=0): ) ( n D x x ∂ = ?in the middle of the base (x=W/2) : ) ( = ∂ x x ?Photo-voltage The photo-voltage derives from the Boltzmann relation: ⋅ = . ln ph 2 i n q III. RESULTS AND DISCUSSION The variation of the gap energy according to the temperature is illustrated by the figure 3: −biz + 2 3 C.A .T .exp( ) L e i n D KT D S ∂ n x f = ( 0 ) (9) 0 Fig.3: Gap Energy versus temperature The separation energy Eg between the conduction band and the valence band, called the width of the forbidden band, determines the electrical behavior of the material. When an electron absorbs an energy greater than or equal to that of the forbidden band, it then passes from the valence band to the conduction band. The energy an electron absorbs can come from thermal agitation or a photon. An increase in temperature irreversibly decreases the width of the band gap. We are interested in this part of the photovoltage profiles as a function of the temperature and the charge carrier collection velocity. ?The evolutions of the electric photovoltage according to the temperature are illustrated by the figure 4. ∂ n x 0 (10) =w 2 0 ( n ) . k T (11) + V 1 N B @ IJTSRD | Unique Paper ID – IJTSRD29193 | Volume – 3 | Issue – 6 | September - October 2019 Page 1119
International Journal of Trend in Scientific Research and Development (IJTSRD) @ www.ijtsrd.com eISSN: 2456-6470 For a wide bandgap material; many carriers are extracted with low kinetic energy [9, 10]. Therefore they fail to jump the barrier to participate in the output stream and are then stored at the junction. An increase in carrier collection velocity causes an irreversible decrease in photovoltage. This decrease is all the more important as the gap energy of the material is low. GaAs has the highest photovoltage because it has the largest gap energy. In figure 5 above, the difference in values of the voltages of the cells makes the profiles of the photovoltages across the GaAs and Si cells not well represented. To better see the profiles of the two photovoltages according to the collection velocity, let us use the following figure 6. Fig.4: Photovoltage versus temperature An electron that is agitated by thermal effect becomes free as soon as its energy reaches a value greater than or equal to the gap. It then passes from the valence band to the conduction band. Moreover, when a solar cell is irradiated, some photons of sufficient incident energy are absorbed by electrons. Thus they move from the valence band to the conduction band. The combined action of these phenomena (photon and temperature) causes a strong charge carriers generation [6, 7]. Thus many electrons under the effect of illumination and temperature are extracted with a high kinetic energy and set in motion. During their chaotic movement some manage to cross massively the junction to participate in the output- current. As a result, the stock of charge carriers at the junction decreases more and more as the temperature increases. This charge carriers stock weakening leads to the photovoltage decrease. This decrease is all the more important as the width of the forbidden band is small. We can therefore admit that solar cells made from materials that have a small width of the forbidden band, have a less important photovoltage [8, 9]. The photovoltage variation across the solar cell according the charge carrier collection velocity is illustrated by the figure 5. Fig. 6: Voltage versus collection of the charge carrier’s velocity This figure shows that the photovoltages have the same profiles as a function of the charge carrier’s collection velocity. When the electron collection efficiency is low, the electrical photovoltages of the solar cells are very high. They decrease when the collection efficiency increases [10]. Figures 5 and 6 allow us to see that for a given temperature, the photovoltage across gallium arsenide solar cell is twice as great as that across a silicon solar cell and ten times greater than that across arsenide indium solar cell. It can therefore be assumed that the most efficient solar cells are those made from wide bandgap materials. IV. CONCLUSION In this simulation work, we made a study of the voltage of three solar cells with parallel vertical junction. These solar cells have the same dimensions and were used in lighting conditions. Photovoltage is important when the material used has a high gap energy. We can therefore estimate that a solar cell is all the more efficient as the width of the forbidden band (gap energy) is large. This work can be deepened by making a comparative study of the electric power or the diffusion capacity of different solar cells made from different materials. REFERENCES [1]Nf. Dieme, “Study of the Electrons Density in the Base of the Parallel Vertical Junction Solar Cell under the Influence of the Temperature”, American Journal of Optics and Photonics. Vol. 3, 1, 2015, p. 13-16. Fig.5: Voltage versus collection of the charge carrier’s velocity The charge carrier collection efficiency characterizes the passage of electrons through the junction. It depends on the kinetic energy acquired by the electron during its extraction. [2]Nf. Dieme “study of the performance of a parallel vertical junction Silicon solar cell under thermal influence”, Asian Academic Research Journal of Multidisciplinary, vol.2, 1, 2015, p. 8-16 @ IJTSRD | Unique Paper ID – IJTSRD29193 | Volume – 3 | Issue – 6 | September - October 2019 Page 1120
International Journal of Trend in Scientific Research and Development (IJTSRD) @ www.ijtsrd.com eISSN: 2456-6470 [3]F. Levy “Traité des matériaux 18 : Physique et technologie des semi-conducteurs”, Polytechniques et Universitaires Romandes, 1995, pp 15-35, [7]S. Valkov “Electronique analogique”, Edition Castéilla, Collection A.CAPLIEZ 1994, pp 20-65, Presses [8]K. Agroui “Etude du Comportement Thermique de Modules Photovoltaïquesde Technologie Monoverre et Biverre au Silicium Cristallin”, Rev. Energ. Ren. : Valorisation, 1999, pp. 7-11. [4]Nf. Dieme, M. Zoungrana, S. Mbodji, H. L., Diallo M. Ndiaye, F. I. Barro and G. Sissoko, “Influence of Temperature on the Electrical Parameters of a Vertical Parallel Junction Silicon Solar Cell under Polychromatic Illumination in Steady State”, Res.J. App. Sci., Eng. and Technology, 2014, vol.7, pp.2559-2562. [9]G. A. Landis, Jenkins P. , David Scheiman; Rafaelle R. Extended Temperature Solar Cell Technology Development”, AIAA 2nd International Energy Conversion Engineering Conferenc August 2004, pp.16- 19. [5]S. M. Sze, K. Ng. Kwok “Physics of Semiconductor Devices”, Third Edition, John Wiley & Sons. 2007,pp 7- 62 [10]Nf. Dieme and M. Sane, “Impact of Parasitic Resistances on the Output Power of a Parallel Vertical Junction Silicon Solar Cell”, Energy and Power Engineering, 8, 2016, pp. 130-136. [6]R. Pässler “Semi-empirical descriptions of temperature dependences of band gaps in semiconductors”, phys. stat. sol. 236, 2003, pp. 710–728. @ IJTSRD | Unique Paper ID – IJTSRD29193 | Volume – 3 | Issue – 6 | September - October 2019 Page 1121