Hawaii Drought
Hawaii Drought. Pao-Shin Chu State Climatologist Department of Meteorology University of Hawaii.

Hawaii Drought
E N D
Presentation Transcript
Hawaii Drought Pao-Shin Chu State Climatologist Department of Meteorology University of Hawaii
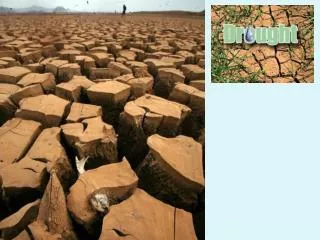
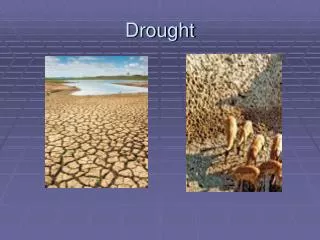
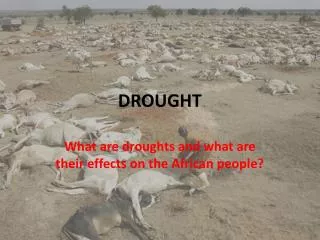
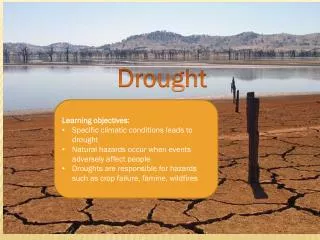
Drought is a chronic and troublesome problem in Hawaii, at one time or another affecting virtually every part of the state. These events often reduce crop yields, diminish livestock herds, desiccate streams, irrigation ditches and reservoirs, deplete groundwater supplies, and lead to forest and brush fires. Source: Hawaii Drought Monitor
Drought can be characterized from the perspectives of meteorology, agriculture, hydrology, and socio-economic impacts. • The meteorological perspective would describe drought as a rainfall deficit compared with some normal or expected rainfall amount. • The agricultural perspective could describe drought by its impacts on the agricultural industry due to reduced rainfall and water supply (e.g., crop loss, herd culling, etc.). • Hydrological descriptions of drought may compare stream flows, ground water, and reservoir levels to normal conditions. • Drought can also be described from the socio-economic perspective by the direct and indirect impacts droughts have on society and the economy (e.g., increased unemployment due to failure of an industry because of drought).
Historical statewide drought events (Hawaii Drought Monitor and R88)
HRI time series (green bars) – 27 stations from 3 islandsNormalized winter (NDJFM) rainfallNino 3.4 SST anomalies (solid curve), Diamond for El Niño
Correlation coefficients between the seasonal SOI and the seasonal Hawaiian rainfall index.Quenouille’s (1952) method was used to account for the reduction of effective numbers of degrees of freedom due to persistence. One and two asterisks indicate significance at the 5 and 1 percent levels, respectively.
Chu and Chen (2005): Interannual and interdecadal rainfall variations in the Hawaiian Islands. J. Climate, 18, 4796-4813.
Winter rainfall difference (inches) of the (El Niño/+PDO) minus (La Niña/-PDO) composite. Dots for rainfall stations (272).
The nonparametric Mann-Whitney test for winter rainfall difference of the (El Niño/+PDO) minus (La Niña/-PDO).
Winter composite of SST (shading) and surface wind (vectors). The unit for SST is °C and for wind vectors is m/s.
Winter 200-mb wind vectors. Isotachinterval is 10 m/s. Area with wind speed greater than 40 m/s is shaded.
Winter composite of east-west vertical circulation. Longitude-height section of zonal wind and negative pressure vertical velocity (U, -ω) is averaged over 15-25°N. Shading is for statistical significance. The Hawaiian Islands are bordered approximately by two vertical lines.
To monitor meteorological droughts, the Standardized Precipitation Index (SPI) is used. • The SPI relies on monthly precipitation as the only input. SPI values can be generated for multiple time series (e.g., 3-mo, 12-mo). This is useful because drought affects various sectors over a wide range of time scales.
Computation of the SPI involves fitting a gamma probability density to a set of precipitation totals for a station using the maximum likelihood approximations. • The resulting gamma parameters are used to find the cumulative probability of a precipitation event for the given time scale. • The cumulative probability is then transformed to the standard Gaussian random variable with mean zero and unit variance, which is the SPI.
The SPI has been embraced by NDMC, WRCC, and the NWS/Honolulu Forecast Office.
Drought classification based on SPI (NDMC) SPI valuesDesignation 0.00 to -0.99 Mild Drought -1.00 to -1.49 Moderate Drought -1.50 to -1.99 Severe Drought -2.00 or less Extreme Drought
UH Hawaii State Climate Office and SSRIFunded through DLNR’s Water Commission Office • Drought Risk and Vulnerability Assessment and GIS Mapping Project
● Another index, the Keetch/Byram Drought Index (KBDI), has been used for the southeast U.S. over 30 years. ● The KBDI, which conceptually describes the soil moisture deficit, is used to assess wildfire potential as part of the revised 1988 U.S. National Fire Danger Rating System. ● This index depends on daily rainfall amount, daily maximum temperature, and the mean annual rainfall.
The relationship between the KBDI and fire activity, as measured by total areas burned, in the Hawaiian Islands was explored (Dolling, Chu, Fujioka, 2005, Agricultural and Forest Meteorology). • Total acres burned (TAB) data from DLNR. Records are short, only 20 yrs (1976-96). • Because of the non-normally distributed nature of the TAB, a log transformation is applied to the TAB data. The correlation between KBDI and TAB is significant for Maui with a p-value well below the 5% level.
A strong relationship between the KBDI and fire activity is found for the islands of Maui and Hawaii.
Summary • Reviewed historical drought events in Hawaii. • Drought in Hawaii generally follows an El Niño event. Long-lead winter (spring) rainfall prediction is feasible. • Drought is also affected by the PDO cycle. Rainfall difference between (El Niño/+PDO) and (La Niña/-PDO).
SPI time series for Kula, Maui since 1950. • Drought risk and vulnerability assessment for Maui County. • Keetch/Byram drought index (KBDI); Relation between KBDI and fire activity for Maui is evident.