Download
1 / 41
500 likes | 791 Vues
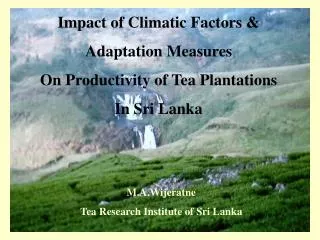
IMPACT OF AND ADAPTATION TO CLIMATE CHANGE ON COCONUT AND TEA INDUSTRY IN SRI LANKA (AS12). T S G Peiris 1 , M A Wijeratne 2 , C S Ranasinghe 1 A Aanadacoomaraswamy 2 , M T N Fernando 1 , A Jayakody 2 and J Ratnasiri 3

E N D
IMPACT OF AND ADAPTATION TO CLIMATE CHANGE ON COCONUT AND TEA INDUSTRY IN SRI LANKA (AS12) T S G Peiris1, M A Wijeratne2, C S Ranasinghe1 A Aanadacoomaraswamy2, M T N Fernando1, A Jayakody2 and J Ratnasiri3 (1Coconut Research Institute of Sri Lanka, Lunuwila, 2Tea Research Institute of Sri Lanka, Talawekella and 3 SLAAS, Sri Lanka),
Outline • Coconut Industry in a nutshell • Climate Change in principal coconut growing regions • Vulnerability & Adaptation - purely stat. model (preliminary) • Tea Industry • Climate change and adaptation – stat. /dynamic (preliminary)
World Situation for Coconut Mean annual production = 48 billion nuts Coconut extent = 11300 million hectares Productivity =4200 nuts/ha
Average contribution on the world production by the major coconut producing countries
Temporal variability of Annual Coconut Production (ACP) Baseline mean
Summary of the historical climate data analysis (1932-2003) The periods of classical rainy seasons, particularly North east monsoon (NEM): Dec-Feb has significantly shifted over the years (p < 0.05). In all regions rainfall during January to March has significantly (p < 0.05) decreased. Tmax, Tmin and Tdif during January to March have significantly (p < 0.05) increased. Rate of increasing of Tmax > Tmin
Correlation between ACP and the quarterly rainfall in principal coconut growing areas - at one year lag
Change in mean RF during Jan-Mar simulated from HadCM3 under three socio-economic scenarios SRES – A1FI SRES – A2 SRES – B1
V & A Assessment (off line) V: Increasing rate of both Jan-Mar rainfall and Tmax are higher in wet zone indicating wet regions are more vulnerable to climate change than dry or intermediate regions. DL5 is not suitable for coconut plantation. A: Shifting coconut areas; Growing of shade trees. V: Pest damage on coconut would increase. A: More research on Integrated Pest Management (IPM). Needs to investigate more money. A: use of innovative methods.
V & A Assessment (off line) V: Problem for mixed farm models Coconut + pasture + cattle Buffalo farming Coconut + Tea Coconut + Intercrops Coconut + Tea
Impact on Production: Integrated statistical approach - Peiris et al. (2004) Yield = Climate Effect of the Previous Year + Technology Effect + Noise Effect
Integrated model Yt = +exp ( + *t) + 1*RF_JFMWL3t-1 + 2*RF_JFMWL4t-1 + 3*RF_APJWL2t-1 - 4*RF_APJIL3t-1 + 5*RF_JASWL4t-1 (R2 = .91, p < 0.001; all coefs. are sig.) 0 < 5 < 4 < 1 < 2 < 3 <1
Validation of the model (r = 0.83, p< 0.0001) (% error varies: [-10% to 10%]
Vulnerable climate indicators on Production At national Level: Jan – Mar rainfall ; Apr – Jun rainfall At regional Level : Jan - Mar rainfall; TMAX. and Intensity of rainfall At farm level: Rainfall during Jan – Feb TMAX, RHPM
Pattern of projected CO2 concentration Y = exp ( +t) = 0.00422 for B1 (R2 =0.94 = AdjR2); = 0.00822 for A2 (R2 =0.99 = AdjR2); = 0.00997 for A1FI (R2 =0.94 = AdjR2)
Technology CO2 increase Thus Yield at given SRES scenario = f(Climate effect) + f (CO2 effect at the same SRES scenario) + noise efect
Projected national coconut production (million nuts) based on two GCM’s combined with three SRES scenarios (a) CSIRO (b) HADCAM 3
National impact – Only one aspect The increase in population and future climate change would affect the availability of nuts in future for industrial purposes Impact = Population x input per capita i.e. I (t) = P(t) x A(t)
Demand for local consumption based on population projection There will be a shortage of nuts around 2040 under B1 scenario.
Analysis of V&A - Multivariate time series approach : Res. Var - Yield Multivariate indicator -----?
National level • Sri Lanka will need to import more substitute oil for coconut oil. • This will have adverse socio-economic implications and national economy. • Serious attention is required for a strategic policy on importation and probably to enhance cooperation in other coconut growing countries in the region.
LIMITATION OF THE STUDY • Not use of multi level model for the analysis of V&A – multivariate time series /Ricardian model • Lack of long-term data on most of the varaibles
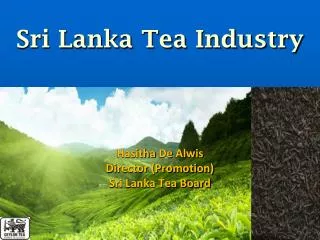
Tea groping areas WU WM IU WL IM
Tea Growing Regions in Sri Lanka Major… U- Up country (>1200m amsl) T:10-27 oC M- Mid country (600-1200m amsl) T:19-30 oC L- Low country (<600m amsl) T:21-34 oC Agro-Ecological Regions…. Up country wet zone (WU 1-3) RF:1400->3175mm Mid country Wet zone (WM 1-3) RF:1250->3150mm Low country Wet zone (WL 1-2) RF:1900->2525mm Up country Intermediate zone (IU 1-3) RF:1150->2150mm Mid country Intermediate zone (IM 2) RF:1150->1400mm
Comparison of productivity between potential and drought years in different regions POTEN. 26% 28% 19% 14% 1991 25% WU IU 1992 WM IM WL
Rainfall (mm) & Productivity (kg/ha/month) Opt.RF=Optimum Rainfall (mm/month) M=Loss of yield (kg/ha/month/mm-RF)
Temperature & Monthly yield (kg/ha) Y= -508+63.7 T – 1.46 T2 (p<0.05) 22 Amarathunga et al,1999
Development of a crop model Respiration-60% Initial Biomass Total Biomass RUE (0.3) LAI (5) HI Tea yield-20% Retained-20% B Density Temperature CO2 Soil Rainfall Moisture Radiation Use Efficiency : RUE Harvest Index: HI Leaf Area Index: LAI
Yield prediction Yield (kg/ha/yr) CO2 RF Temp WL WM WU IU (ppm) (%) (oC) 370 0 0 2489 2217 2454 2651 370 0 1 2282 2177 2651 2569 370 0 2 2070 2117 2760 2469 370 -10 0 2456 2161 2418 2591 370 10 0 2482 2305 2480 2749 435 0 0 2710 2695 3035 3080 435 0 1 2502 2567 3235 2998
Crop improvement Drought tolerant cultivars
Soil Improvements Soil & soil moisture conservation Irrigation Soil Organic Carbon improvements
Crop environment Shade management Intercropping
CONCLUSIONS Expected climate change in Sri Lanka due to global climate change scenarios has significant impact on both coconut and tea industry. The climate change scenarios can help to identify the potential directions to the impacts and potential magnitudes of the overall effects. The magnitudes of changes should be looked with caution due to uncertainties in prediction process of climate. Impact of climate change on coconut production should be studied in other coconut producing countries as well.
THANK YOU Acknowledgements Indian Agric. Research Inst., India IGCI, University of Waikato, NZ