Download
1 / 26
300 likes | 841 Vues
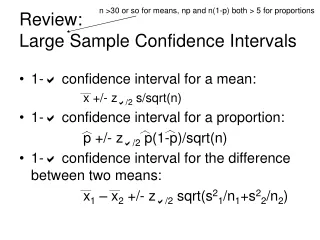
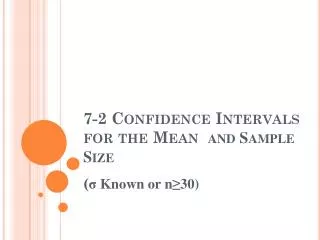
7-2 Confidence Intervals for the Mean and Sample Size. ( σ Known or n ≥ 30). 7.2 Confidence Intervals for the Mean When Is Known. Some background review We’ve learned to use the sample mean to estimate the population mean

E N D
7-2 Confidence Intervals for the Mean and Sample Size (σ Known or n≥30)
7.2 Confidence Intervals for the Mean When Is Known • Some background review • We’ve learned to use the sample mean to estimate the population mean • A point estimate is a specific numerical value estimate of a parameter: • The best point estimate of the population mean µ is the sample mean
Three Properties of a Good Estimator • The estimator should be an unbiased estimator. That is, the expected value or the mean of the estimates obtained from samples of a given size is equal to the parameter being estimated. • The estimator should be consistent. For a consistent estimator, as sample size increases, the value of the estimator approaches the value of the parameter estimated. • The estimator should be a relatively efficient estimator; that is, of all the statistics that can be used to estimate a parameter, the relatively efficient estimator has the smallest variance.
Confidence Intervals for the Mean When Is Known • Since we are dealing with an estimate, we will “hedge our bet” and calculate an interval that should contain the actual parameter we are estimating • An interval estimate of a parameter is an interval or a range of values used to estimate the parameter. • This range may or may not contain the value of the parameter being estimated.
Confidence Level of an Interval Estimate • So the interval should contain the parameter, but it may not… • The confidence level of an interval estimate of a parameter is the probability that the interval estimate will contain the parameter, assuming that a large number of samples are selected and that the estimation process on the same parameter is repeated.
Confidence Level of an Interval Estimate • We refer to the value that yields a confidence level as alpha (a) • Ex: alpha of 0.05 gives us a 95% confidence interval
Confidence Interval • A confidence interval is a specific interval estimate of a parameter determined by using data obtained from a sample and by using the specific confidence level of the estimate. • Ex: “the 95% confidence interval (CI) of the mean is (45.32 to 47.88)” • 3 common intervals: 90, 95 and 99
Formula for the Confidence Interval of the Mean for a Specific a For a 90% confidence interval: For a 95% confidence interval: For a 99% confidence interval:
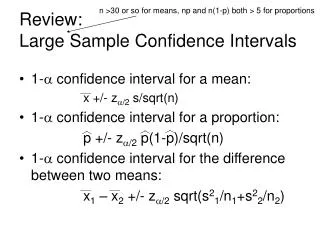
The Formula for the Confidence Interval of the Mean for a Specific • Formula • For a 90% confidence interval, z/2 = 1.65 • For a 95% confidence interval, z/2 = 1.96 • For a 99% confidence interval, z/2 = 2.58
Maximum Error of the Estimate Recall the formula The maximum error of the estimate is the maximum likely difference between the point estimate of a parameter and the actual value of the parameter.
Confidence Interval for a Mean Rounding Rule When you are computing a confidence interval for a population mean by using raw data, round off to one more decimal place than the number of decimal places in the original data. When you are computing a confidence interval for a population mean by using a sample mean and a standard deviation,round off to the same number of decimal places as given for the mean.
Example 7-1 P. 352: Days to Sell an Aveo A researcher wishes to estimate the number of days it takes an automobile dealer to sell a Chevrolet Aveo. A sample of 50 cars had a mean time on the dealer’s lot of 54 days. Assume the population standard deviation to be 6.0 days. Find the best point estimate of the population mean and the 95% confidence interval of the population mean. The best point estimate of the mean is 54 days.
Example 7-1: Days to Sell an Aveo One can say with 95% confidence that the interval between 52 and 56 days contains the population mean, based on a sample of 50 automobiles.
Example 7-2 P.360: Ages of Automobiles A survey of 30 adults found that the mean age of a person’s primary vehicle is 5.6 years. Assuming the standard deviation of the population is 0.8 year, find the best point estimate of the population mean and the 99% confidence interval of the population mean. The best point estimate of the mean is 5.6 years. One can be 99% confident that the mean age of all primary vehicles is between 5.2 and 6.0 years, based on a sample of 30 vehicles.
95% Confidence Interval of the Mean One can be 95% confident that an interval built around a specific sample mean would contain the population mean.
Example 7-3 P.362: Credit Union Assets The following data represent a sample of the assets (in millions of dollars) of 30 credit unions in southwestern Pennsylvania. Find the 90% confidence interval of the mean. 12.23 16.56 4.39 2.89 1.24 2.17 13.19 9.16 1.42 73.25 1.91 14.64 11.59 6.69 1.06 8.74 3.17 18.13 7.92 4.78 16.85 40.22 2.42 21.58 5.01 1.47 12.24 2.27 12.77 2.76
Example 7-3: Credit Union Assets Step 1: Find the mean and standard deviation. Using technology, we find = 11.091 and s = 14.405. Step 2: Find α/2. 90% CL α/2 = 0.05. Step 3: Find zα/2. 90% CL α/2 = 0.05 z.05 = 1.65
Example 7-3: Credit Union Assets Step 4: Substitute in the formula. One can be 90% confident that the population mean of the assets of all credit unions is between $6.752 million and $15.430 million, based on a sample of 30 credit unions.
Formula for Minimum Sample Size Needed for an Interval Estimate of the Population Mean Recall the formula and realize that as n gets larger, the error in our estimate gets smaller. Since we can use algebra to arrive at the sample size needed for a particular a interval estimate. where E is the maximum error of estimate. If necessary, round the answer up to obtain a whole number.
Example 7-4 P.364: Depth of a River A scientist wishes to estimate the average depth of a river. He wants to be 99% confident that the estimate is accurate within 2 feet. From a previous study, the standard deviation of the depths measured was 4.38 feet. Therefore, to be 99% confident that the estimate is within 2 feet of the true mean depth, the scientist needs at least a sample of 32 measurements.