Understanding Aggregate Supply Diagrams in Economics
Learn about the effects of increases in aggregate supply on price levels, expansion along the AD curve, and causes of cost-push inflation. Discover how economic growth stems from a nation's productive potential.

Understanding Aggregate Supply Diagrams in Economics
E N D
Presentation Transcript
Aggregate Supply Diagrams Unit 2 Economics Revision
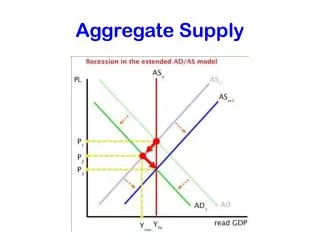
Price Level LRAS Rise in aggregate supply causes an expansion along the AD curve SRAS1 SRAS2 AD = C+I+G+X-M Real National Output (Y) Ye Y1 Y2
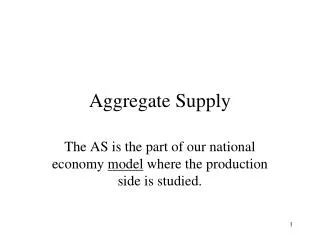
LRAS Average Price Level SRAS2 SRAS1 A fall in the exchange rate can cause import prices to rise – a cause of cost-push inflation P2 P1 AD = C+I+G+X-M Real National Output (Y) Y1 Y2 YP
LRAS2 LRAS1 Average Price Level Economic growth comes from an increase in a country’s productive potential SRAS AD3 AD2 AD1 Real National Output (Y) Y1 Y2 Y3