Understanding Business Inventory Measurements and Their Economic Impact
50 likes | 162 Vues
This article explores the key metrics of inventory to sales ratios, as measured by the US Census Bureau and the Department of Commerce. It discusses how these ratios are derived from three surveys and their significance as leading economic indicators. A high investment in business inventories can signal a thriving economy, while steady increases are ideal for growth. The piece also highlights the implications of inventory data for market analysis, business cycle timing, and economic trends, alongside the latest inventory statistics with a two-month delay in data release.

Understanding Business Inventory Measurements and Their Economic Impact
E N D
Presentation Transcript
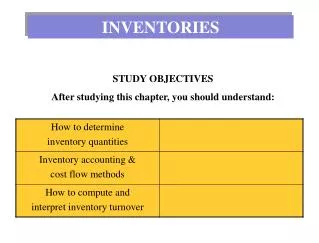
About the number • A rate or ratio of inventory to sales ratios • Measured by the US Census Bureau News • US Department of Commerce
How is the number measured? Three surveys What do they do?
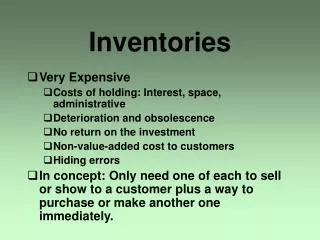
The effects of the number • Estimates the leading economic indicator series • Used for Market Analysis • Indicating the timing, duration, and magnitude of business cycle • If high investment in business, economy thrives • Gradual, steady increase is best
What is the latest value? Two month delay Statistics have not been released for September