Gender and Minority Representation in Physical Sciences: A Statistical Overview
310 likes | 422 Vues
This overview presents statistical insights into gender and minority representation in undergraduate and graduate physical sciences. It details graduation rates, employment trends, and the "leaky pipeline" effect from B.S. to Ph.D. levels. Statistics on employment, tenure, and median salaries of women and minorities compared to their male counterparts are provided. Additionally, the document highlights social psychology findings on stereotype threat and unconscious bias affecting performance and expectations. The goal is to foster awareness and promote equity within the field.

Gender and Minority Representation in Physical Sciences: A Statistical Overview
E N D
Presentation Transcript
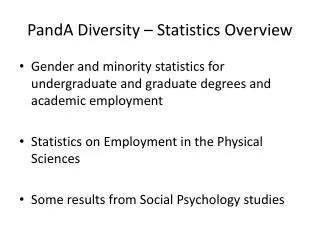
PandA Diversity – Statistics Overview • Gender and minority statistics for undergraduate and graduate degrees and academic employment • Statistics on Employment in the Physical Sciences • Some results from Social Psychology studies
Attrition between B.S. and Ph.D. degrees (“Leaky Pipeline”) 45 % in 2006 All fields: 57 % in 2000 Physics: 22% B.S. in 2000 to 17% Ph.D. in 2006 This trend continues to assistant and tenured professor
Percent of Women earning Physics and Astronomy degrees Data from Tables 5-3, 5-4, 7-2, and 7-4 www.nsf.gov/statistics/wmpd/tables.cfm
Undergrad Minority Representation Percent of Physics and Astronomy Bachelors Data from Table 5-3 www.nsf.gov/statistics/wmpd/tables.cfm
Graduate Minority Representation Percent of Physics and Astronomy Doctorates Data from Table 7-4 www.nsf.gov/statistics/wmpd/tables.cfm
Gender Representation in 2008, by Academic Position Data from Table 9-22www.nsf.gov/statistics/wmpd/tables.cfm
Race/Ethnicity Representation in 2008, by Academic Position Data from Table 9-22www.nsf.gov/statistics/wmpd/tables.cfm
Employment Statistics: Questions • Do women and minorities in physical sciences seek different types of employment from men/non-minorities? • For scientists in tenure-track positions at universities and colleges, are tenure rates the same for men and women, minorities and majorities? • Are the reasons for unemployment and part-time employment the same? • What are the median salaries of women and minorities vs men in physical sciences?
S&E doctorate holders in jobs at a university or 4-year college in the physical sciences
Tenure rates of S&E doctorate holders employed as scientists at a university or 4-year college in tenure-applicable jobs
Unemployment rates of scientists and engineers, by race/ethnicity and sex: 2006 URM=under-represented minority
Reasons for unemployment of scientists and engineers, by race/ethnicity and sex: 2006
Part-time employment rates of scientists and engineers, by race/ethnicity and sex: 2006
Reasons for part-time employment of scientists and engineers, by race/ethnicity and sex: 2006
Employment status of spouses of employed S&E doctorate holders, by sex: 2001
Median salary of scientists and engineers at Universities or 4-year colleges by gender, race/ethnicity, and years since doctorate
Stereotype Threat Performance on a Challenging Math Test, by Stereotype Threat Condition and Gender Stereotype Threat Condition: participants are told that the test had shown gender differences in the past. Reinforcing stereotypes can create real differences in performance. Source: Spencer, S. J., Steele, C. M., & Quinn, D. M., 1999, "Stereotype threat and women's math performance," Journal of Experimental Social Psychology, 35(1), p. 13.
Different Standards Students’ Standards for Their Own Performance, by Gender Respondents were asked: “How high would you have to score to be convinced that you have high ability at this task?” When participants are told “Men are better at this task,” women hold themselves to a higher standard. Stereotypes can increase feelings of being “not good enough.” Source: Correll, S.J., 2004, “Constraints into preferences: Gender, status, and emerging career aspirations,” American Sociological Review, 69, p. 106, Table 2.
Unconscious Bias Even people who consciously reject negative stereotypes can still hold those beliefs at an unconscious level. You can discover your own biases at: https://implicit.harvard.edu/implicit/demo/ We will be hosting an expert in this field, Dr. Abby Stewart, here at JHU who will give a talk on the subject at the end of March. Stay tuned!
Unconscious Bias: Studies • Search committee for assistant professor prefers Brian to Karen 2:1 even though their application packages are exactly the same. (Steinpreis, Anders, & Ritzke (1999) Sex Roles, 41, 509) • Mother (active in PTA) vs. non-mother applications evaluated as less competent, called back half as often, offered lower starting salaries. Father vs. non-father applications seen as more committed to paid work and offered higher starting salaries. (Correll, Benard and Paik (2007) American Journal of Sociology, 112 (5), 1297-1338) • Letters of Recommendation show gender differences. Letters for women are shorter, have more references to personal life, and contain more “doubt raisers” such as: “It’s amazing how much she’s accomplished.” “It appears her health is stable.” “She is close to my wife.” (Trix & Psenka (2003) Discourse & Society, Vol 14(2): 191-220)
The End! We will be putting these slides on our website at pha.jhu.edu/~nuala