Download

1 / 0
0 likes | 117 Vues
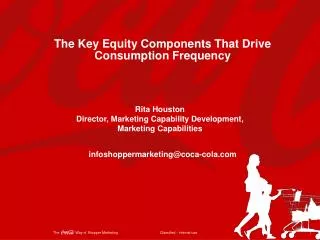
Explore the essential equity components that significantly impact consumption frequency in consumer behavior. Rita Houston, Director of Marketing Capability Development, delves into the relationship between brand love and brand value. Gain insights on how these elements drive repeat purchases and foster lasting connections with consumers. Discover effective strategies to enhance brand equity and increase market share, strengthening your brand's position in a competitive landscape.

E N D