Analyzing Welfare Spending and Impact on Work Incentives
Explore the history and impact of welfare programs like AFDC and TANF on work behavior and family structures. Understand subsidy mechanisms like EITC and SSI, and analyze Medicaid expenditure policies.

Analyzing Welfare Spending and Impact on Work Incentives
E N D
Presentation Transcript
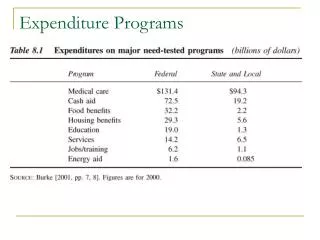
Expenditure Programs • Table 8.1 shows that welfare spending is a shared expense between the federal and state/local governments. • Subsidized medical care (mainly Medicaid) exceeded $215 billion in 2000. • Cash assistance (including the Earned Income Tax Credit) exceeded $91 billion in 2000.
AFDC • Started 1935, Gutted 1996 • Many argued it decreased work incentives • May do so, look at indifference curves &budget constraint flowing from a time endowment. (leisure, income) • Kinked, budget constraint, not likely to decrease leisure over horizontal part of BC • Welfare dependence • 25% of women who received AFDC stayed on it 10 years or more • Doesn’t mean they don’t want to work, could mean options remain poor • Some argue it hurts the family structure • Between 60s & 80s, WF benefits decreased in real terms while the proportion of children not living w/ 2 parents continued to increase • No demonstrated connection between WF & family structure • (including # of children, there is however links between affluence & small families & between education & small families)
AFDC Open-ended entitlement – anyone who qualifies gets AFDC No time limits – could be on program indefinitely No work requirements Cost sharing by federal and state governments – open ended costs State determines benefit levels subject to broad federal guidelines High tax rates on earned income TANF No “entitlement” – limited funding Time limited for at most 5 years Work requirements Block grant to states – costs to federal government are not open ended States have even more control of the design of the program States have option to lower tax rates on earned income AFDC/TANF differencesBoth programs are largely targeted toward single parent households with children under 18.
TANF • Benefit reduction rates (also known as tax rates) vary from 33% to 100%. • 100% tax rate means that if a welfare recipient earns $1 in the labor market, her welfare benefit is reduced by exactly $1. • Welfare grant levels vary tremendously • More than cost-of-living differences alone could explain • For a three-person family with no other sources of income, grant was: • $801 for the family each month in Minnesota • $164 for the family each month in Alabama
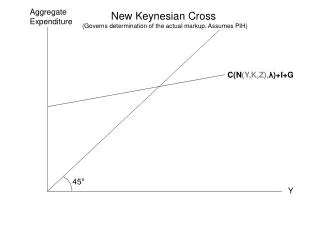
Introducing the Welfare System into the Analysis • It is never rational in Figure 8.6 to work between 0 and PR hours. • This special case does not explicitly depend on a person’s indifference curves, because the tax rate is 100%. • It is not true, however, that all people leave the labor force when the tax rate on welfare benefits is 100%. • Figure 8.7 illustrates a person with a high level of work effort, who attains higher utility at E2 than at P.
Introducing the Welfare System into the Analysis • Do high tax rates really matter for work behavior of welfare recipients? • Moffitt (2002) concluded that AFDC led to a 10-50% labor supply reduction among welfare recipients. • When TANF was introduced and tax rates were lowered, the proportion of welfare recipients who had any earnings increased from 6.7% in 1990 to 28.1% in 1999. • Other factors, like work requirements and an improving economy, clearly matter, too. • led to Workfare, a welfare arrangement where able-bodied individuals receive transfer payments only if they agree to participate in a work-related activity and accept employment.
EITC • The earned income tax credit (EITC) is the largest cash transfer to low-income individuals, and is administered through the tax system, not the welfare system. • Comes in form of tax credit, which is a reduction in a person’s tax liability. It is possible to have a negative tax liability – meaning the government owes the person money rather than the other way around. • EITC has grown dramatically over time, with an annual cost now exceeding $31 billion. • Subsidy depends on: • Family structure / number of children • Earnings • Figure 8.8A summarizes the size of the credit as income increases for a family with two children.
SSI • Supplemental Security Income (SSI) provides cash benefits for the aged, blind, and disabled. • SSI usually provides more generous benefits, lower tax rates, and more uniformity than TANF/AFDC. • SSI recipients may be perceived as being “more deserving” although there is some skepticism about many of the disabled recipients.
Medicaid • Medicaid is the largest spending program for the poor. • Initially established in 1965, provided health insurance to recipients of cash welfare (AFDC and SSI) • Has expanded over time; now covers many children and pregnant women who have no other attachment to the welfare system • By 2002, 40.1 million Medicaid recipients. • Program costs exceed $219 billion. • A number of policy issues arise in the provision of Medicaid. • “Crowd-out” • “Medicaid Notch”
Medicaid Notch • The “taxation” of Medicaid is quite different from the taxation of cash benefits or food stamps. • Cash benefits are smoothly taken away, albeit at high tax rates. • Medicaid is retained in its entirety, as long as a person is eligible for cash assistance, and taken away in its entirety if a person is ineligible for cash assistance. • This structure creates implicit tax rates far greater than 100% for becoming ineligible for TANF/AFDC. • Although a person might typically lose, say $0.80 of cash benefits for earning an extra $1.00 in the labor market, at the “Medicaid notch” she would also lose health insurance that could be valued at several thousand dollars.
Food Stamps • Virtually all poor people can receive food stamps (unlike cash assistance and Medicaid). • In 2001, around 17.3 million food stamp participants each month, at an annual cost of $16 billion. • Food stamps are an in-kind benefit and, as shown in the previous chapter, may be valued as less than their face value. • Evidence suggest people buy more food when they have food stamps rather than the cash equivalent transfer. • Takeup rate for food stamps is only around 70% of eligible households. • Possibly some “welfare stigma” associated with participation.