Download
1 / 25
250 likes | 417 Vues
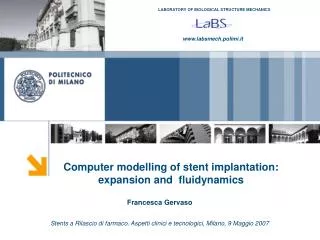
FLUID MECHANICAL PERTURBATIONS INDUCED BY STENT IMPLANTATION: A NUMERICAL STUDY. Rossella Balossino, Francesca Gervaso, Francesco Migliavacca, Gabriele Dubini LaBS, Department of Structural Engineering, Politecnico di Milano, ITALY. INTRODUCTION. INTRODUCTION.

E N D
FLUID MECHANICAL PERTURBATIONS INDUCED BY STENT IMPLANTATION: A NUMERICAL STUDY Rossella Balossino, Francesca Gervaso, Francesco Migliavacca, Gabriele Dubini LaBS, Department of Structural Engineering, Politecnico di Milano, ITALY
INTRODUCTION A vascular stent is a small metal tube, which is inserted into an artery at the site of a narrowing to act as an internal scaffolding or a support to the blood vessel.
IN-STENT RISTENOSIS Intimal thickening following a stent implantation with progressive lumen reduction Three phases (Edelman e Rogers, 1998): + PROLIFERATION first 3 weeks + REMODELING 10/12 months INFLAMMATION during implantation MOTIVATION [Mehran R., 2002] HYPOTHESIS: non physiological stress state field responsible for restenosis.
STATE OF THE ART QUANTITIES OF INTEREST • Effect of wire spacing, wire diameter, vessel diameter and flow conditions [Moore et al.,2002] • Stent design: number, thickness and width of the strut • Deployment ratio • Comparison of resting or maximal vasodilatation condition [LaDisa et al.,2003-2004-2005] • Foreshortening • Changes in vascular geometry after stent deployment • Effect of vessel curvature [Seo et al., 2005] • Non-Newtonian condition [Soulis et al.,2002; Seo et al.,2005; Bernard et al.,2004] QUANTITATIVELY OBSERVED PARAMETERS • wall shear stress (WSS) distribution • velocity vectors • recirculation length • velocity profiles
THE PROBLEM FROM SIMPLIFIED MODELS … TO PLAQUE MODEL Migliavacca et al., Proceedings of 2005 Summer Bioengineernig ASME Conference Healthy artery Artery with plaque Expansion under displacement control until a diameter of 3 mm was reached The stent geometry was modelled as shell elements • Cordis BX Velocity (Johnson & Johnson Interventional System, Warren, NJ, USA)
METHODS • Preliminary step: structural analysis This step is necessary to obtain the correct configuration for the fluid dynamics simulations: fluid domain
METHODS First step: creation of the fluid domain Point cloud of the deformed configuration 1 Creation of the curves and surfaces 2 Creation of each volume 3 Substraction and creation of the final fluid domain 4
ASSUMPTION: • rigid vessel wall • Newtonian fluid: Viscosity = 0.0035 kg/(m∙s) Density = 1060 kg/m3 METHODS OUTLET Constant fixed pressure Second step: Boundary conditions WALL LaDisa et al. (2005) No slip condition 4 cardiac cycles pulse period = 0.54 s INLET Velocity profile: parabolic and transient Fluent (Fluent Inc., Lebanon, NH, USA)
dynes/cm2 50 25 0 OBSERVATIONS STENTED REGION 0.16 s HEALTHY MODEL PLAQUE MODEL • The highest WSS magnitude can be noticed on the stent
dynes/cm2 18 9 0 OBSERVATIONS ARTERIAL REGION INSIDE STENT STRUTS 0.16 s HEALTHY MODEL PLAQUE MODEL • high WSS in the regions between the stent struts • low WSS were localized around stent struts
AIM OF THE STUDY ? ? Is it correct to ignore the presence of an atherosclerotic plaque • four different stent designs previously expanded against the same stented artery • Cordis BX Velocity stent like (Johnson & Johnson Interventional System, Warren, NJ, USA) • Jostent Flex stent like (JOMED AB, Helsingborg, Sweden) • Sorin Carbostent stent like (Sorin Biomedica S.p.A., Saluggia (VC), Italy) • Palmaz-Schatz stent like (Johnson & Johnson Interventional System, Warren, NJ, USA) • transient simulation for each model • comparison of the WSS magnitude distribution during time
RADIUS LENGTH THICKNESS a fter exp a nsio n a fter exp a nsio n CORDIS 1.5 3.53 0.1 JOSTENT 1.5 2.30 0.1 PALMAZ 1.5 2.97 0.1 SORIN 1.55 3.50 0.1 STENT MODELS Length: 11.68 mm Internal diameter: 2.15 mm Thickness: 0.5 mm Length: 3.68 mm Internal diameter: 1.25 mm Thickness: 0.45 mm
100 95 0.16 s % of cells 0.32 s 90 0.44 s 0 s 0.4 s 85 0 s 0.16 s 0.32 s 0.4 s 0.44 s RESULTS: WALL SHEAR STRESSES WSS < 5 dynes/cm2 • correlated with sites of intima thickening and smooth muscle cells migration • locations where stagnation of blood occurs • prone to thrombus formation and platelet accumulation
SORIN CORDIS 100 95 % of cells 90 85 0 s 0.16 s 0.32 s 0.4 s 0.44 s [dynes/cm2] JOSTENT PALMAZ 5 2.5 0 RESULTS: LOW WSS WSS < 5 dynes/cm2 0 s
SORIN CORDIS 100 95 % of cells 90 85 0 s 0.16 s 0.32 s 0.4 s 0.44 s [dynes/cm2] JOSTENT PALMAZ 5 2.5 0 RESULTS: LOW WSS WSS < 5 dynes/cm2 0.16 s
RESULTS: MAXIMUM WSS ON STENT [dynes/cm2] 50 40 30 20 CORDIS 10 PALMAZ JOSTENT 0 SORIN 0 s 0.16 s 0.32 s 0.4 s 0.44 s
[dynes/cm2] 50 40 30 20 10 0 0.16 s RESULTS: MAXIMUM WSS
RESULTS: MAXIMUM WSS ON THE ARTERIAL WALL [dynes/cm2] 20 15 10 5 CORDIS PALMAZ JOSTENT 0 SORIN 0 s 0.16 s 0.32 s 0.4 s 0.44 s
LIMITATIONS AND ASSUMPTIONS • Rigid wall: valid in the stented region • Newtonian fluid • Straight vessel: neglecting the curvature of the coronary artery • Post implant condition • Single strut • Symmetric and hyperelastic plaque
Carreau model:[Seo et al., 2005] WORKS IN PROGRESS • Rigid wall: valid in the stented region • Newtonian fluid • Straight vessel: neglecting the curvature of the coronary artery • Post implant condition • Single strut • Symmetric and hyperelastic plaque
WORKS IN PROGRESS • Rigid wall: valid in the stented region • Newtonian fluid • Straight vessel: neglecting the curvature of the coronary artery • Post implant condition • Single strut • Symmetric and hyperelastic plaque • Influence of the stent length:
0.15 mm 0.1 mm CORDIS JOSTENT SORIN PALMAZ WORKS IN PROGRESS • Influence of the strut thickness: comparison of different stent design with same • thickness
CONCLUSIONS • In each stent model the WSS distribution is similar: • the maximum values are located over the stent strut • the arterial wall portion delimited by the links and the stent strut showed an increasing WSS value from the zones near the stent to the centre • WSS values change during the cardiac cycle, showing an oscillatory behaviour • The comparison among the four stent models indicates that: • Jostent shows the lowest WSS value during the whole cardiac cycle • the best model in terms of minimal neointima thickening is the Cordis stent • the maximum WSS on the stent and the arterial wall occurs in the Cordis stent at the systolic peak • CFD techniques have the advantages of producing accurate information on local flow variables very close to the arterial wall • CFD can thus provide a research tool by complementing experimental studies, especially where experimental measurements are difficult to perform and affected by uncertainties.