Download
1 / 27
270 likes | 382 Vues
The Lightning Forecast Algorithm (LFA) optimizes lightning threat forecasts ranging from 1-36 hours using the Weather Research and Forecasting (WRF) model. The LFA utilizes proxy fields from simulated convection to calibrate and construct threat forecasts based on observations of total lightning activity (LMA). It aims to provide accurate peak flash rate densities and is designed to be a cost-effective solution for generating gridded Lightning data, applicable for potential data assimilation use, optimizing storm prediction efficiency and enhancing public safety.

E N D
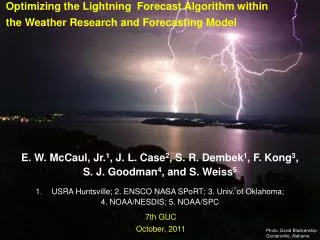
Optimization and Expansion of the WRF Lightning Forecast Algorithm E. W. McCaul, Jr.1 J. Case2, T. Chronis3, F. Kong4, S. Dembek1, S. Goodman5, S. Weiss6 1: USRA; 2: ENSCO, NASA SPoRT; 3: UAH; 4: OU CAPS; 5: NOAA NESDIS; 6: NOAA SPC WOF Meeting Apr 2014 Photo, David Blankenship Guntersville, Alabama
LFA Objectives Given LTG link to large ice, and a cloud-scale model like WRF, which prognoses hydrometeors, LFA seeks to: Create WRF forecasts of LTG threat (1-36 h), based on simple proxy fields from explicitly simulated convection Construct an empirically calibrated threat that yields accurate quantitative peak flash rate densities and areal coverages, based on LMA total LTG observations 3. Provide an affordable yet robust algorithm for use in making gridded proxy LTG data, and for potential uses with DA, without need for full electrification scheme
LFA Method Compare WRF forecasts of graupel flux at -15C to LMA observations of peak FRD within storm outbreaks Find best linear fit of peak WRF proxy to LMA peak FRD Generate additional WRF LTG proxy using VII, and rescale its peak value to match that from GFX 4. Threshold GFX to zero where GFX < 1.5 5. Create a blend of GFX and VII threats, using weights 0.95GFX + 0.05VII, to achieve correct threat areal coverage
2-km horizontal grid mesh 51 vertical sigma levels Dynamics and physics: Eulerian mass core Dudhia SW radiation RRTM LW radiation YSU PBL scheme Noah LSM WSM 6-class microphysics scheme (graupel; no hail) 8h forecast initialized at 00 UTC with AWIP212 NCEP EDAS analysis; Also used METAR, ACARS, and WSR-88D radial vel at 00 UTC; Eta 3-h forecasts used for LBCs WRF Configuration (LFA study)Prototypical Original Case
4-km horizontal grid mesh 35 vertical sigma levels Dynamics and physics: Eulerian mass core Dudhia SW radiation RRTM LW radiation MYJ PBL scheme Noah LSM WSM 6-class microphysics scheme (graupel; no hail) 36h forecast initialized at 00 UTC with AWIP212 NCEP EDAS analysis on 40 km grid; 0-36-h NAM forecasts used for LBCs WRF Configuration (NSSL)Typical Operational Case
Convective regimes - predictability:1. Supercell cases well handled quantitatively by LFA;2. Multicell cases are predicted by LFA, but handled less well quantitatively;3. LFA seems to provide best results for convective regimes that are most predictable; 4. LFA relies heavily on accurate forecasts of midlevel w; WRF seems to have difficulty in unsheared, multicell regimes, where it may not always represent midlevel updraft speeds accurately;5. LTG rates are to some extent proxies for midlevel updraft; thus real-time comparison of LFA FRD with LMA FRD says something about realism of WRF forecasts of storm w.
Year-2 LFA studies, CAPS WRF, 2011:(examined to assess sensitivity to model physics packages) Preliminary findings for spring weather, AMJ20111. CAPS Spring Expt runs used; focus is on severe storms, especially supercells; spring 2011 had good WRF diversity 2. Spring 2011: several major supercell days, little wx diversity3. Examined LFA ranges, SDs in the CAPS WRF configurations as a function of ensemble mean LFA output4. LFA range, SD increases slowly as LTG rates increase, with fractional errors bigger at low FRD5. Assessed average LFA performance for specific microphysics configurations: WSM6, WDM6, Thompson 2-moment6. WSM6, WDM6 yield LTG FRDs bigger than ensemble mean; Thompson scheme yields LTG FRDs smaller
CAPS 2011 Experiments Model IC (arw_cn+) BC micro LSM PBL S4cn +00zARPSa 00zNAMf Thompson Noah MYJ S4m4 +em-p1 pert 21zSREF em-p1 Morrison RUC YSU S4m5 +em-p2 pert 21zSREF em-p2 Thompson Noah QNSE S4m6 +nmm-p1 pert 21zSREF nmm-p1 WSM6 RUC QNSE S4m7 +nmm-p2 pert 21zSREF nmm-p2 WDM6 Noah MYNN S4m8 +rsm-n1 pert 21zSREF rsm-n1 Ferrier RUC YSU S4m9 +eKF-n1 pert 21zSREF eKF-n1 Ferrier Noah YSU S4m10 +eKF-p1 pert 21zSREF eKF-p1 WDM6 Noah QNSE S4m11 +eBMJ-n1 prt 21zSREF eBMJ-n1 WSM6 RUC MYNN S4m12 +eBMJ-p1 prt 21zSREF eBMJ-p1 Thompson RUC MYNN S4m13 +rsm-p1 pert 21zSREF rsm-p1 M-Y Noah MYJ S4m14 +em-n1 pert 21zSREF em-n1 Ferrier+ Noah YSU S4m15 +em-n2 pert 21zSREF em-n2 WSM6 Noah MYNN S4m16 +nmm-n1 pert 21zSREF nmm-n1 Ferrier+ Noah QNSE S4m17 +nmm-n2 pert 21zSREF nmm-n2 Thompson Noah ACM2 S4m18 +rsm-p2 pert 21zSREF rsm-p2 WSM6 Noah MYJ S4m19 +rsm-n1 pert 21zSREF rsm-n1 M-Y Noah MYJ S4m20 +rsm-n2 pert 21zSREF rsm-n2 M-Y RUC ACM2
CAPS 2011 results Mean, range, SD vs. LTG1, all stormy hours Variations are large for weak lightning, in a relative sense Variations slowly Increase as LTG increases
CAPS 2011 results Mean, range, SD vs. LTG1, x = expt 18, WSM6 Mean relative to full ensemble = 1.07 (4 expts) CAPS 2011 had four WSM6 expts
CAPS 2011 results Mean, range, SD vs. LTG1, x = expt 7, WDM6 Mean relative to full ensemble = 1.57 (2 expts) CAPS 2011 had two WDM6 expts
CAPS 2011 results Mean, range, SD vs. LTG1, x = expt 17, Thompson Mean relative to full ensemble = 0.71 (4 expts) CAPS 2011 had four Thompson expts
CAPS 2011 findings (preliminary):expt micro LSM PBL mean (ensemb.-rel.) 3 Thompson Noah MYJ 0.831 5 Thompson Noah QNSE 0.80812 Thompson RUC MYNN 0.59017 Thompson Noah ACM2 0.613 6 WSM6 RUC QNSE 1.25711 WSM6 RUC MYNN 0.92015 WSM6 Noah MYNN 0.99818 WSM6 Noah MYJ 1.089 7 WDM6 Noah MYNN 1.41310 WDM6 Noah QNSE 1.726
CAPS 2011 findings (preliminary):1. Variations in LFA flash rate estimates display sensitivity to choices of microphysics, other physics packages;2. CAPS 2011 offers desirable set of 1- and 2-moment micro choices, facilitating intercomparisons (2012 all 2-moment);3. WDM6 produces the most graupel, so that LFA peak values are 1.57 times bigger than grand ensemble average; WSM6 average is 1.07 times bigger; Thompson 2-moment scheme is only 0.71 times as large;4. For recalibration of Thompson to match WSM6, must boost Thompson results by a factor (1.07/0.71) = 1.50; 5. 2011 CAPS runs offer too few storm days, too little storm type diversity; full calibration may be problematic; examine HRRR data from a variety of cases
SPoRT 2012 findings (preliminary):1. Matrix of 24 runs per date for each of 5 dates at MOB, HGX;2. 8 microphysics paired with 3 PBL yields 24 runs with clear attributability of effects on LFA of schemes used;3.Microphysics:WSM6,Lin,Goddard,WDM6,Thompson,Morrison, Milbrandt,NSSL4. PBL: MYJ, QNSE, MYNN5. For recalibration of Thompson to match WSM6, can compare WSM6/MYJ, as in NSSL, to Thompson/MYNN, as in HRRR 6. Took peak LTG threat over each 24-h date, and made intercomparisons with WSM6/MYJ benchmark results; no LMA validations attempted for these runs
SPoRT 2012 findings (preliminary):1. Sample snapshot of output from MOB 20120703 run shows variability of LFA flash rate densities
SPoRT 2012 findings (preliminary):site date THOM WSM6 THOM/WSM6HGX 0612 0.00 10.64 0.00HGX 0616 0.00 5.79 0.00HGX 0703 0.00 0.00 ???HGX 0707 4.89 13.76 0.3554HGX 0716 3.88 8.81 0.4404MOB 0518 0.00 0.00 ???MOB 0615 1.79 5.26 0.3403MOB 0619 0.00 0.00 ???MOB 0703 9.50 14.87 0.6389MOB 0803 3.39 4.55 0.7451mean 0.36
SPoRT 2012 findings (preliminary):1. Considerable dependence on microphysics; WDM6 scheme often most intense, Thompson often less intense;2. Considerable dependence on PBL scheme; QNSE scheme often most intense, MYNN often less intense;3. MET tool shows best statistical matching of precip objects with NSSL 2-moment, QNSE PBL (most expensive combo); 4. Thompson/MYNN yields LTG threat amplitudes only about 0.36 of WSM6/MYJ, but ranging from 0.00 to 0.75;5. Excluding zero Thompson events, need to multiply by factor ranging from 1.33 to 2.94, averaging 2.78, to match WSM6;6. SPoRT WRF runs also sensitive to initialization data (not shown)
Areal coverage validation (preliminary):1. Extended the validation of LFA areal coverage predictions to additional cases beyond those in the original 2009 paper2. Used NALMA flash extent density peaks as ground truth in comparisons with peak areal coverages from LFA events3. LFA peak areal coverages were computed for FRD flash rate thresholds of 0.01, 0.02, 0.03, 0.04, etc., then plotted against observed NALMA peak areal coverages (see figure)4. Many events lie close to the diagonal, but a few cases have LFA areas that are always too small; a tiny number having small observed areas are too large5. Overall impression: best choice for threshold FRD = 0.08, larger than before; will slightly reduce threat areas.
Future Work:1. Continue collaborations with NSSL, CAPS, HRRR, others to implement, test revised LFA;2. Continue study of revised LFA in CAPS ensembles and in SPoRT matrix of simulations; finish custom recalibration of LFA for HRRR WRF with Thompson microphysics; 4. Assess LFA for dry summer LTG storms in w USA;5. Examine HWRF, HRRR runs to assess LFA in TCs;6. Pursue addition of CG prediction capability in LFA (see next page)
Future Work:1. LFA predicts total LTG; need CG fraction to get CG rates; comparison of LTG data and radar data shows a strong negative relationship between VIL, CG fraction, which might be useful in estimating CG fraction based on modeled VIL:
Acknowledgments:This research was first funded by the NASA Science Mission Directorate’s Earth Science Division in support of the Short-term Prediction and Research Transition (SPoRT) project at Marshall Space Flight Center, Huntsville, AL, and more recently by theNOAA GOES-R R3 Program. Thanks to Mark DeMaria, Ingrid Guch, and also Gary Jedlovec, Rich Blakeslee, and Bill Koshak (NASA), for ongoing support of this research. Thanks also to Paul Krehbiel, NMT, Bill Koshak, NASA, Walt Petersen, NASA, for helpful discussions. For published paper, see:McCaul, E. W., Jr., S. J. Goodman, K. LaCasse and D. Cecil, 2009:Forecasting lightning threat using cloud-resolving model simulations. Wea. Forecasting, 24, 709-729.