Download
1 / 50
500 likes | 723 Vues
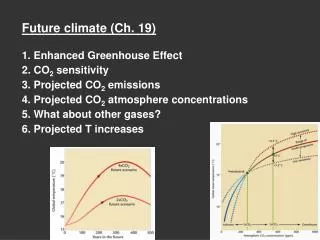
Future climate (Ch. 19) 1. Enhanced Greenhouse Effect 2. CO 2 sensitivity 3. Projected CO 2 emissions 4. Projected CO 2 atmosphere concentrations 5. What about other gases? 6. Projected T increases. 2000: 365 ppm. 1. Enhanced Greenhouse Effect. 1800: 280 ppm. anthropogenic

E N D
Future climate (Ch. 19) 1. Enhanced Greenhouse Effect 2. CO2 sensitivity 3. Projected CO2 emissions 4. Projected CO2 atmosphere concentrations 5. What about other gases? 6. Projected T increases
2000: 365 ppm 1. Enhanced Greenhouse Effect 1800: 280 ppm anthropogenic increase in CO2 and CH4
What will happen to Earth’s climate system as the abundance of greenhouse gases in the atmosphere continue to increase? What we need to know is Earth’s “CO2 sensitivity”
2. CO2 sensitivity T changes caused by changing CO2 abundance by given amount CO2 sens. = (T change) / (change in CO2 amount) e.g., for 2 x CO2 amount, 4 x CO2 amount
CO2 sensitivity CO2 sens. = (T change) / (change in CO2 amount) or T change = (CO2 sens.) x (change in CO2 amount) For given CO2 change: If sensitivity high, T change large If sensitivity low, T change small
Equivalent CO2 a measure of the amount of the combined effect of all greenhouse gases, calculated as if CO2 were the only greenhouse gas
GCM results for CO2 sensitivity 560 ppm 280 ppm
GCM results for CO2 sensitivity Much variation. Intergovernmental Panel on Climate Change (IPCC, 2007): +2.5 oC for 2 x CO2 280 ppm 560 ppm
Q: Why is there so much uncertainty in determining CO2 sensitivity?
Q: Why is there so much uncertainty in determining CO2 sensitivity? A: Because of feedbacks.
T - water vapor feedback
T - albedo feedback less snow & ice, lower albedo more absorption of radiation by ground
GCM results for CO2 sensitivity Curves less steep Why? Curves steeper
Q: Can’t we determine CO2 sensitivity by using recent known temperature and CO2 changes?
Q: Can’t we determine CO2 sensitivity by using recent known temperature and CO2 changes? A: Yes, but… We have to consider that response lags behind forcing And consider SO2 pollution
Effect of SO2 pollution • SO2 released from burning, e.g. S-bearing coal • This SO2 combines with water to make • sulfuric acid • Get cooling effect & acid rain SO2 + 2H2O = H2SO4 + 2H gas liquid liquid in solution Produces cooling effect in atmosphere-- what book calls “sulfate” aerosol
SO2 pollution and sulfate
Temperature variations correlated with SO2 pollution? x x x 1950-2000 Average: +0.7 oC/100 yrs x = major sulfate aerosol sources
Thought experiment illustrating different response times for CO2 and SO2
Q: Can’t we determine CO2 sensitivity by using past climate info?
Q: Can’t we determine CO2 sensitivity by using past climate info? A: Yes, to some extent.
a CO2 data: vegetation changes T data: various b b a CO2 data: ice cores T data: various
3. Projected CO2 emissions % increase = % increase change change in in C in x in emission x efficiency of emissions population per person of C use
Projected CO2 emissions % increase = % increase change change in in C in x in emission x efficiency of emissions population per person of C use Likely to get higher or lower?
max x max
Projected CO2 emissions % increase = % increase % change % change in in C in x in emission x efficiency of emissions population per person of C use Likely to get higher or lower?
Projected CO2 emissions % increase = % increase % change % change in in C in x in emission x efficiency of emissions population per person of C use • Likely to get higher or lower? • Standard of living? • C taxes? Cap & trade? • Conservation?
Projected CO2 emissions % increase = % increase % change % change in in C in x in emission x efficiency of emissions population per person of C use Likely to get higher or lower?
Projected CO2 emissions % increase = % increase % change % change in in C in x in emission x efficiency of emissions population per person of C use • Likely to get higher or lower? • Fuel type • (oil, gas, bituminous coal, • anthracitic coal, oil shale? H??) • Technology • Wind? Solar? Nuclear? • Biofuels?
Current trends (from pre-industrial CO2 value = 280 ppm) Q: Why do curves reach maximum? minimum
Current trends (from pre-industrial CO2 value = 280 ppm) Q: Why do curves reach maximum? A: We run out of fossil fuels minimum
4. Projected CO2 atmosphere concentration • How does Earth redistribute CO2? • Some stays in atmosphere • Some goes into biomass • Some into oceans • (over millions of years: into rock) Roughly half of atmosphere value
5. What about other gases? sulfur dioxide SO2 methane CH4 concentrations of both will probably go up
CH4 Melting of methane clathrate ice in deep ocean & in permafrost
6. Projected temperature increase What should happen on Earth as temperature increases?
What should happen on Earth as • temperature increases? • More evaporation, more rain overall (exceptions!) • Cloudier • Less glaciers, sea ice, icesheets • More forests at high latitudes • More plant growth • Higher sealevel • Changes in habitat • Change in season length
Assumes mid-range CO2 sensitivity: +2.5 oC for 2 x CO2 +5 oC for 4 x CO2 300 yrs 130 yrs
Use past as guide to the future? 4 x CO2 path (likely) could lead in 50-500 to Earth like it was 10-50 Myr ago But… different now in rate at which system changing
2 x CO2 in year 2100 IPCC (2007) sea level: +30 cm
Change in seasons at mid-latitudes
2 x CO2 scenario at peak warming More change at high latitudes (>40 o) especially in winter (why?)
4 x CO2 Yr 2200-2300 Sea level: +1 to 2 m Sea level: +1 to 2 m
“Estimated future changes in climate will be on a scale comparable to the largest natural changes of the past… We are now ~0.7 oC of the way [out of 2.5-5 oC projected warming] into this huge new experiment in transforming our planet… Unless technology or extreme conservation efforts intervene, Earth is headed toward a warmer future at rates that are unprecedented in its 4.5-billion-year history” --Ruddiman, p. 357