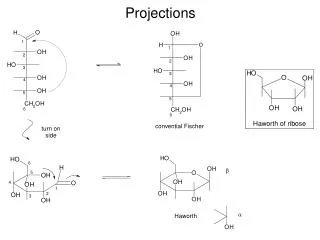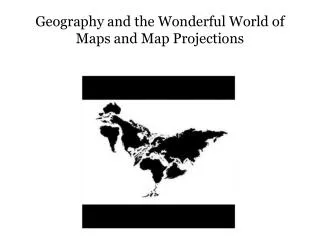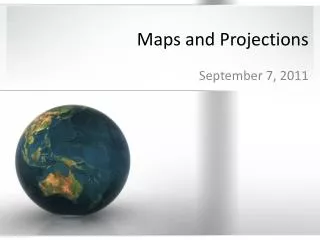
Maps, Projections, Tools
Explore the fascinating world of maps, from their history and purpose to the different types and projections used. Learn how maps can be powerful tools for understanding spatial distribution and conveying information.

Maps, Projections, Tools
E N D
Presentation Transcript
Unit 1- Introducing Basic Concepts Maps, Projections, Tools
Maps • Geography’s most important tool for thinking spatially about the distribution of features across Earth is a map • Definition: • A two-dimensional or flat-scale model of Earth’s surface • Science of mapmaking called cartography • A map serves two purposes: • Reference tool • Communications tool
History of the Map • Earliest Maps were reference tools • Designed to show a traveler how to get from Point A to Point B • Important Names • Eratosthenes • Coined the word “geography” • Determined circumference of the world • Ptolemy • Produced maps used for over 1000 years • Aristotle • Determined Earth was spherical • Exploration Age • Cartography revived during Age of Exploration thanks to Columbus, Magellan, and other explorers • Between 1470-1520 1st map with “America” labeled appears
Contemporary Mapping • Uses • Describe data • Sources of data • Tools for analysis • Example: • Hurricane Katrina • Representations of the world • Usually two-dimensional graphic representations that use lines and symbols to convey information or ideas about spatial relationships
Types of Maps • Topographic Maps • Designed to represent Earth’s surface and to show permanent features such as buildings, highways, field boundaries, and political boundaries • Device for representing the form of Earth’s surface is the contour • A line that connects points of equal distance above or below a zero data point, usually sea level
Types of Maps • Reference Maps • Show common features such as boundaries, roads, and mountains • Thematic Maps • Designed to represent the spatial dimensions of particular conditions, processes, or events • Types of Thematic Maps • Isopleth maps • Maps based on isolines • A line that connects places of equal data value • Dot maps • Single dot or other symbol represents a specified number of occurrences of some particular phenomenon or event • Choropleth map • Tonal shadings are graduated to reflect variations in numbers, frequencies, or densities
Map Scale: • refers to the relationship of a feature’s size on a map to its actual size on earth • Ratio between linear distance on a map and linear distance on Earth’s surface • Usually expressed in terms of corresponding lengths: • as in one centimeter equals one kilometer • Or as a representative fraction • Small scale maps= bigger fraction • Large scale maps = smaller fraction
Scale Differences: Maps of Florida The effects of scale in maps of Florida. (Scales from 1:10 million to 1:10,000)
Types of Scale • Fractional • shows the numerical ratio between distances on the map on earth’s surface • example: 1:24,000 • Means 1 map unit= 24, 000 units on ground Written • relationship between the map and earth distances in words • example: 1 inch equals 1 mile • 1st number represents map’s distance • 2nd number represents earth’s distance • Graphic • consists of a bar line marked to show distance on the earth’s surface • example: • What scale you use depends on what information you are portraying
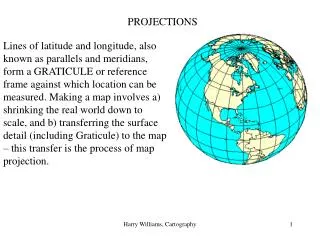
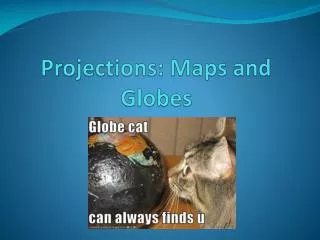
talking map Projection • Definition: • the scientific method of transferring locations on the earth’s surface to a flat map • earth’s surface is curved and not a perfect sphere. It is impossible to represent on a flat plane without distortion • Four problems: • the shape of an area can be distorted • the distance between two points may increase or decrease • the relative size of different areas may be altered so that one area may appear larger • the direction from one place to another can be distorted.
the Solution????? • Different types of projections • Equidistant Projections • can represent distance accurately in only one direction (usually north-south) • usually provide accurate scale in perpendicular direction • most aesthetically pleasing • Conformal Projections • Projection on which compass directions are rendered accurately
Types of Map Projections: • Equal-Area: • Relative sizes of the landmasses on the map are the same as in reality • Minimizes distortion • Mercator: • Shape is distorted little • Direction is consistent • Map is rectangular • Distorts area • higher latitudes distorted - Greenland appears huge! • Fuller: • maintains accurate size and shape • completely rearranges direction • Robinson: • Useful for displaying oceans • Disadvantage = land areas are much smaller • distorts all 4 but minimizes errors in each (most balanced) • Azimuthal: • puts N or S pole at center of map • view of looking up or down at earth
Mercator Projection The world’s 24 standard time zones are often depicted using the Mercator projection.
Different Projections • Peters • Deliberate attempt to give prominence to underdeveloped countries of equatorial regions and the Southern Hemisphere • Adopted by United Nations • Shape gives “shock value” • Cartogram • Space is transformed according to statistical factors • Largest mapping units represent greatest statistical values
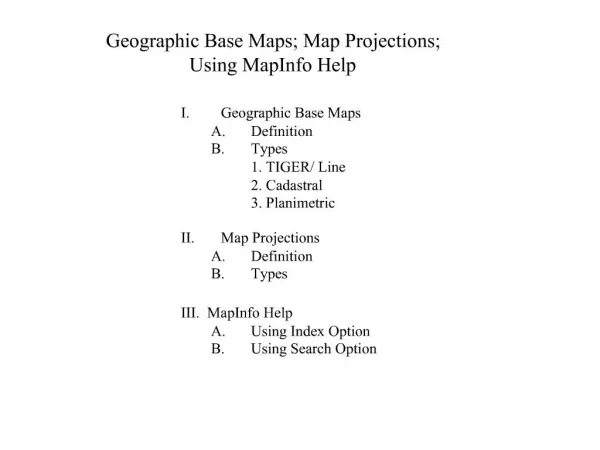
Geographic Grid • Definition: • System of imaginary arcs drawn in a grid pattern on Earth’s surface • The location of any place on Earth’s surface can be described precisely by meridians and parallels • Meridian • An arc drawn between the North and South poles • Location of each meridian = longitude • Measured from the Prime Meridian (0-180 degrees East or West) • Greenwich, England • Parallel • A circle drawn around the globe parallel to the equator and at right angles to the meridians • Location of each parallel= Latitude • Measured from the Equator (0-90 degrees North or South)
Basic Tools and Methods of Human Geographers • Observation • Information must be collected and data recorded • Methods: • Fieldwork • Use of scientific instruments • Laboratory experiments • Archival searches • Remote sensing • Aerial photography or satellite imagery designed to record data on visible, infrared, and microwave sensor systems • Visualization or Representation Written descriptions • Charts • Diagrams • Tables • Analysis • Heart of geographic research • Objective analysis is to discover patterns and establish relationships so that hypotheses can be established and models be built
Remote Sensing • Remote Sensing • acquisition of data about earth’s surface from satellite images that are transmitted in digital form. • Remote-Sensing satellites scan the Earth’s surface • Geographers use remote sensing to map the changing distribution of a wide variety of features such as: • Agriculture, drought, and sprawl • Example • used with Hurricane Katrina to monitor areas of impact
Global Positioning System (GPS) • Definition: • System that accurately determines the precise location of something on Earth • GPS in the United States includes three elements: • Satellites placed in predetermined orbits by the U.S. military • 24 in operation, 3 in reserve • Tracking stations to monitor and control the satellites • A reciever that can locate at least 4 satellites to pinpoint locations • GPS devices enable private individuals to contribute to the production of accurate digital maps • Travelers can upload information about streets, buildings, etc. to improve maps in the future • GPS is most commonly used for navigation • Can also be used for fieldwork for history, geography, etc.
Geographic Information System (GIS) • Definition: • a computer system that can capture, story, query, analyze, and display geographic data. • Produces maps that are more accurate and attractive than hand-drawn maps • The position of any object on Earth can be measured and stored in a computer • A map can be created by retrieving a number of stored objects and combining them to form an image • Each type of information is stored in a layer • Layers can be compared t0 show relationships among different kinds of information
Layers of a GIS • Each layer represents a different category of information.
Geographical Information Systems • GIS technology can render visible many aspects of geography there were previously unseen • Images that could never be drawn by hand • GIS can put places under the microscope, creating detailed new insights using huge databases • Military applications • Allows infantry commanders to calculate line of sight from tans and defensive emplacements • Allows cruise missiles to fly below enemy radar • GIS allows an enormous range of problems to be addressed • Geodemographic research • Uses census and commercial data about the populations of small districts in creating profiles for market research