US Crop Production, 2007
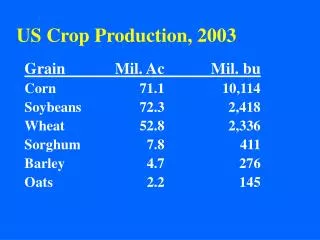
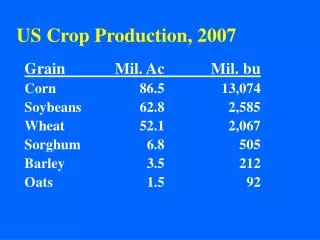
US Crop Production, 2007. Grain Mil. Ac Mil. bu Corn 86.5 13,074 Soybeans 62.8 2,585 Wheat 52.1 2,067 Sorghum 6.8 505 Barley 3.5 212 Oats 1.5 92. Grain Marketing Channel. Local elevators Often initial collection point for grain Grading, drying, some storage First pricing point

US Crop Production, 2007
E N D
Presentation Transcript
US Crop Production, 2007 Grain Mil. Ac Mil. bu Corn 86.5 13,074 Soybeans 62.8 2,585 Wheat 52.1 2,067 Sorghum 6.8 505 Barley 3.5 212 Oats 1.5 92
Grain Marketing Channel • Local elevators • Often initial collection point for grain • Grading, drying, some storage • First pricing point • Some processing (particularly feed) • Subterminal elevators • Concentrate grain for shipment • Limited storage • Purchase from local elevators
Grain Marketing Channel • Terminal Elevators • Processing • Exports • Export terminal elevators • Ocean port or seaway • Limited storage
Grain Pricing • Central price discovery point for grain is the commodity futures markets. • Local markets price on a basis to the futures • Basis accounts for • Location: transportation and local supply and demand conditions • Time: storage cost relative to a futures delivery • Form: type of grain, quality and condition
Grain Pricing • Global supply and demand factor in through the futures market daily • Local prices based on futures through a basis unique to each market • Basis within a market impacted by local conditions
Mississippi River & • Tributaries in the Midwest • Columbia & Snake Rivers • in the West
CSX, Norfolk Southern and • Illinois Central (part of CN) • in the East • BNSF and UP in the West
Transportation Decisions • Alter place or location utility • Must compare price difference to cost difference • High first cost and lower marginal cost • Fixed amount to load commodity • Lower marginal cost of extra miles • Cost difference by type of transportation
Truck Transportation • Low fixed – high variable • 90% of cost is fuel, wages, and maintenance • Trucker doesn’t invest in the road • Dominate short haul choice • Grain shipments by tuck increasing • Regional grain processing • Consolidation of livestock production
Rail Transportation • High fixed cost – low variable • Rail line owns tracks and terminals • Fixed costs may be 30-50% up to 70% of total costs • Economies of size in labor and switching cost so movement to “unit” trains (100 cars). • Differential pricing for large and small customers
Barge Transportation • Low fixed cost – low variable cost • 25,000 miles of inland waterways • 6 miles per hour travel speed. • 70% of exported grain moves down the Mississippi River
Bulk to Container Shipping • Move from commodities to HVP • For example, identity preserved (IP) grain • Can handle small lots • In 2002 52% of ag trade value was shipped by containers compared to 15% of the weight. • Farmers may market container loads of grain direct to customer
Container Advantages • Less handling of grain thus less damage • Container acts as storage • Can be transported on container train or ship • Faster delivery time to final customer • Good backhaul rates from Asia due to trade imbalance • 40% utilization rate going to Asia • 100% utilization coming from Asia
Storage as a strategy • Grain must be dry and stay in condition • On farm • Off farm at elevator • Add time utility
On Farm Storage Advantages • Avoid harvest time low prices • Avoid lines at elevator • Increases marketing period • Helps management of income for taxes • Low marginal cost for longer storage • Allows quality control for livestock feed • May be needed for IP grain
On Farm Storage Disadvantages • Extra handling of grain • Risk of adverse price change while in storage (may be offset with hedging) • Risk of grain going out of condition • Added investment and tax (on farm) • Must finance storage (opportunity cost of the money tied up in grain)
Drying and conditioning grain • Corn harvested at higher moisture than can be safety stored • Harvest may begin with moisture at 20-25% • No. 2 corn is 14.5% moisture • Store at 13.5% moisture or less to avoid spoilage and storage loss • Harvest losses increase as moisture declines • Drying in the field reduces drying cost but increases harvest loss
Storage and drying cost example • Harvest mid-October at 19.5% moisture • Store until mid-May and sell Harvest price (14.5% moisture) $2.30 Extra dry @ $.02/point x 1 pt +0.02 Storage (on-farm) $.01/month +0.07 Interest @ 9.0% x 7/12 x $2.30 +0.12 May price needed to breakeven $2.51
Other Cash Grain Tools • USDA Farm Program Tools • Marketing loan • Loan Deficiency Payment (LDP) • Can use one or the other but not both on the same bushel of grain
Marketing Loan • USDA program started in 1996 • 16 crops including corn and soybeans • Designed to help farmers market their crop throughout the year by providing the farmer a loan until the grain is sold • Grain serves a collateral • Nine month maximum loan
Two Price Components • Loan Rate • Amount that the commodity is valued at • Set by USDA • Posted County Price (PCP) • Is calculated daily for each county by Farm Service Agency of the USDA • Based the higher of the Kansas City or New Orleans Gulf price • Accounts for transportation back to county
How it works • Farmer borrows from government after harvest at the loan rate • Pays back at later date at the PCP
Marketing Loan • Repaying the loan • Prices > loan rate + accrued interest • repay loan + interest • sell the grain at the higher price • Price < loan rate + accrued interest • repay loan at the PCP • keep difference (loan rate – PCP) • you still own the grain • Nonrecourse • Deliver the grain and keep the loan payment
Loan deficiency payment • Difference between the loan rate and PCP • LDP is not repaid • Must have ownership of grain • Coordinate paperwork with FSA office • Collect at any time before it expires • Unless grain is sold or priced at the time the LDP is collected the farmer is speculating on the price of the grain
Marketing Loan or LDP • ML is a free price floor (put option) • Guaranteed minimum price (loan rate) • Sell at higher price less storage and interest • LDP has price risk • Hope for falling prices to maximize LDP • Then hope for rising prices to sell grain • Problem arise if markets fall after taking LDP
Expected Returns and Risks of Alternative Marketing Strategies Marketing Alternative LDP Now + Put Under Loan + LDP, Hedge, and Store Until Summer Store Until Summer Store Until Summer Expected Revenue $51,875.20 $44,304.23 $51,675.00 5% chance that revenue will be below $39,525.41 $32,000.00 $50,113.59 10% chance that revenue will be below $41,816.80 $34,121.20 $50,441.10 25% chance that revenue will be below $45,939.84 $38,244.23 $51,033.97 50% chance that revenue will be below $51,216.95 $43,521.34 $51,688.34 75% chance that revenue will be below $57,003.88 $49,308.27 $52,293.98 90% chance that revenue will be below $62,992.82 $55,297.21 $52,875.12 95% chance that revenue will be below $66,664.02 $58,968.42 $53,266.58