Download
1 / 42
420 likes | 525 Vues
Explore the stock, flow, rates, and outcomes of renal transplants from 1996-2005. Analyze new patients, functioning grafts, transplant rates, patient and graft survival, and post-transplant complications through detailed tables and figures. Gain valuable insights on transplant trends, prevalence rates, causes of failure, and patient characteristics.

E N D
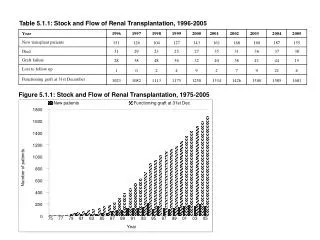
New patients Functioning graft at 31st Dec 1800 1600 1400 1200 1000 Number of patients 800 600 400 200 0 75 77 79 81 83 85 87 89 91 93 95 97 99 01 03 05 Year Table 5.1.1: Stock and Flow of Renal Transplantation, 1996-2005 Figure 5.1.1: Stock and Flow of Renal Transplantation, 1975-2005
Rate, pmp 10 9 8 7 6 New Transplant rate, pmp 5 4 3 2 1 0 75 77 79 81 83 85 87 89 91 93 95 97 99 01 03 05 Year Table 5.1.2: New transplant rate per million population (pmp), 1996-2005 Figure 5.1.2: New transplant rate, 1996-2005
Rate, pmp 70 65 60 55 50 45 40 Transplant Prevalence rate, pmp 35 30 25 20 15 10 5 0 75 77 79 81 83 85 87 89 91 93 95 97 99 01 03 05 Year Table 5.1.3: Transplant prevalence rate per million population (pmp), 1996-2005 Figure 5.1.3: Transplant prevalence rate, 1996-2005
Table 5.2.1: Renal Transplant Recipients’ Characteristics, 1996-2005
Table 5.2.2: Primary causes of end stage renal failure, 1996-2005
Table 5.3.1: Type of Renal Transplantation, 1996-2005 *Commercial Cadaver (China, India, other oversea) *Commercial live donor (living unrelated) *Cadaver (local)
Table 5.4.1: Post transplant complications, 2004-2005 * Hypertension: BP systolic > 140 and BP diastolic >90 OR have either Beta blocker / Calcium channel blocker / ACE inhibitor / AIIRB / Other anti-hypertensive
Table 5.4.2: Transplant Patients Death Rate and Graft Loss, 1996-2005 *Graft loss=graft failure *All losses=death / graft loss (acute rejection happens concurrently with graft failure/ death)
Annual death rate 70 60 50 40 Death rate percent 30 20 10 0 75 77 79 81 83 85 87 89 91 93 95 97 99 01 03 05 Year Figure 5.4.2(i): Transplant Recipient Death Rate, 1975-2005
Annual graft loss rate 18 16 14 12 10 Graft loss rate percent 8 6 4 2 0 75 77 79 81 83 85 87 89 91 93 95 97 99 01 03 05 Year Figure 5.4.2(ii): Transplant Recipient Graft Loss Rate, 1975-2005
Table 5.4.3: Causes of Death in Transplant Recipients, 1996-2005
Table 5.4.5: Patient survival, 1993-2005 * No.=Number at risk SE=standard error Figure 5.4.5: Patient survival, 1993-2005
Table 5.4.6: Graft survival, 1993-2005 * No.=Number at risk SE=standard error Figure 5.4.6: Graft survival, 1993-2005
Table 5.4.7: Patient survival by type of transplant, 1993-2005 * No.=Number at risk SE=standard error
1.00 Live donor Commercial cadaver Commercial live donor 0.75 Cumulative survival 0.50 Cadaver 0.25 0.00 0 2 4 6 8 10 12 Duration in years Figure 5.4.7: Patient survival by type of transplant, 1993-2005
Table 5.4.8: Graft survival by type of transplant, 1993-2005 * No.=Number at risk SE=standard error
Figure 5.4.8: Graft survival by type of transplant, 1993-2005 1.00 Commercial cadaver Live donor 0.75 Commercial live donor Cumulative survival 0.50 Cadaver 0.25 0.00 0 2 4 6 8 10 12 Duration in years
Table 5.4.9: Patient survival by year of transplant (Living related transplant, 1993-2005) * No.=Number at risk SE=standard error
1.00 Year 1999-2005 Year 1993-1998 0.75 Cumulative survival 0.50 0.25 0.00 0 1 2 3 4 5 6 7 Duration in years Figure 5.4.9: Patient survival by year of transplant (Living related transplant, 1993-2005)
1.00 Year 1999-2005 0.75 Year 1993-1998 Cumulative survival 0.50 0.25 0.00 0 1 2 3 4 5 6 7 Duration in years Table 5.4.10: Graft survival by year of transplant (Living related transplant, 1993-2005) * No.=Number at risk SE=standard error Figure 5.4.10: Graft survival by year of transplant (Living related transplant, 1993-2005)
1.00 Year 1999-2005 Year 1993-1998 0.75 Cumulative survival 0.50 0.25 0.00 0 1 2 3 4 5 6 7 Duration in years Table 5.4.11: Patient survival by year of transplant (Commercial cadaver transplant, 1993-2005) * No.=Number at risk SE=standard error Figure 5.4.11: Patient survival by year of transplant (Commercial cadaver transplant, 1993-2005)
1.00 Year 1999-2005 0.75 Year 1993-1998 Cumulative survival 0.50 0.25 0.00 0 1 2 3 4 5 6 7 Duration in years Table 5.4.12: Graft survival by year of transplant (Commercial cadaver transplant, 1993-2005) * No.=Number at risk SE=standard error Figure 5.4.12: Graft survival by year of transplant (Commercial cadaver transplant, 1993-2005)
Table 5.5.1: Risk factors for IHD in renal transplant recipients at year 2004 and 2005 ** Hypertension: BP systolic > 140 and BP diastolic >90 OR have either Beta blocker / Calcium channel blocker/ ACE inhibitor/ AIIRB / Other anti-hypertensive drugs GFR(mL/min/1.73m2) = 1.2*(140-age(year))* weight(kg) / creatinine(µmol/L) if male GFR(mL/min/1.73m2) = 0.85*(1.2*(140-age(year))* weight(kg) / creatinine(µmol/L) ) if female. CKD stage III – GFR, 30- 60 CKD stage IV – GFR, 15- 30 CKD stage V – GFR, < 15
Figure 5.5.1a: Venn Diagram for Pre and Post Transplant Complications (in %) at year 2004
Figure 5.5.1b: Venn Diagram for Pre and Post Transplant Complications (in %) at year 2005
Systolic BP <120 Systolic BP <130 Systolic BP 130-139 Systolic BP 140-159 Systolic BP 160-179 Systolic BP >=180 100 90 80 70 60 Percent 50 40 30 20 10 0 2004 2005 Year Figure 5.5.2a: Systolic BP, 2004 and 2005
Diastolic BP <80 Diastolic BP <85 Diastolic BP 85-89 Diastolic BP 90-99 Diastolic BP 100-109 Diastolic BP >=110 100 90 80 70 60 Percent 50 40 30 20 10 0 2004 2005 Year Figure 5.5.2b: Diastolic BP, 2004 and 2005
CKD Stage 1 CKD Stage 2 CKD Stage 3 CKD Stage 4 CKD Stage 5 100 90 80 70 60 Percent 50 40 30 20 10 0 2004 2005 Year Figure 5.5.3: CKD stages by year
BMI <20 BMI 20-25 BMI 25-30 BMI > 30 100 90 80 70 60 Percent 50 40 30 20 10 0 2004 2005 Year Table 5.5.4: BMI, 2004 – 2005 Figure 5.5.4: BMI by year
LDL <2.6 LDL 2.6-3.4 LDL >= 3.4 100 90 80 70 60 Percent 50 40 30 20 10 0 2004 2005 Year Table 5.5.5a: LDL, 2004 – 2005 Figure 5.5.5a: LDL by year
Table 5.5.5b: Total Cholesterol, 2004 - 2005 Figure 5.5.5b: Total Cholesterol by year Total Cholesterol <4.1 Total Cholesterol 4.1-5.1 Total Cholesterol 5.1-6.2 Total Cholesterol 6.2-7.2 Total Cholesterol > 7.2 100 90 80 70 60 Percent 50 40 30 20 10 0 2004 2005 Year
HDL <1 HDL, 1-1.3 HDL > 1.3 100 90 80 70 60 Percent 50 40 30 20 10 0 2004 2005 Year Table 5.5.5c: HDL, 2004 - 2005 Figure 5.5.5c: HDL by year
Table 5.5.6a: Treatment for hypertension, 2004 – 2005 Table 5.5.6b: Distribution of Systolic BP without anti-hypertensives, 2004 – 2005 Table 5.5.6c: Distribution of Diastolic BP without anti-hypertensives, 2004 – 2005
Table 5.5.6d: Distribution of Systolic BP on anti-hypertensives, 2004 – 2005 Table 5.5.6e: Distribution of Diastolic BP on anti-hypertensives, 2004 – 2005