Temperature Changes in Heating Ice Experiment
40 likes | 67 Vues
Investigate how temperature changes as ice is heated, collect qualitative and quantitative data, draw a graph, and analyze the results for a lab write-up.

Temperature Changes in Heating Ice Experiment
E N D
Presentation Transcript
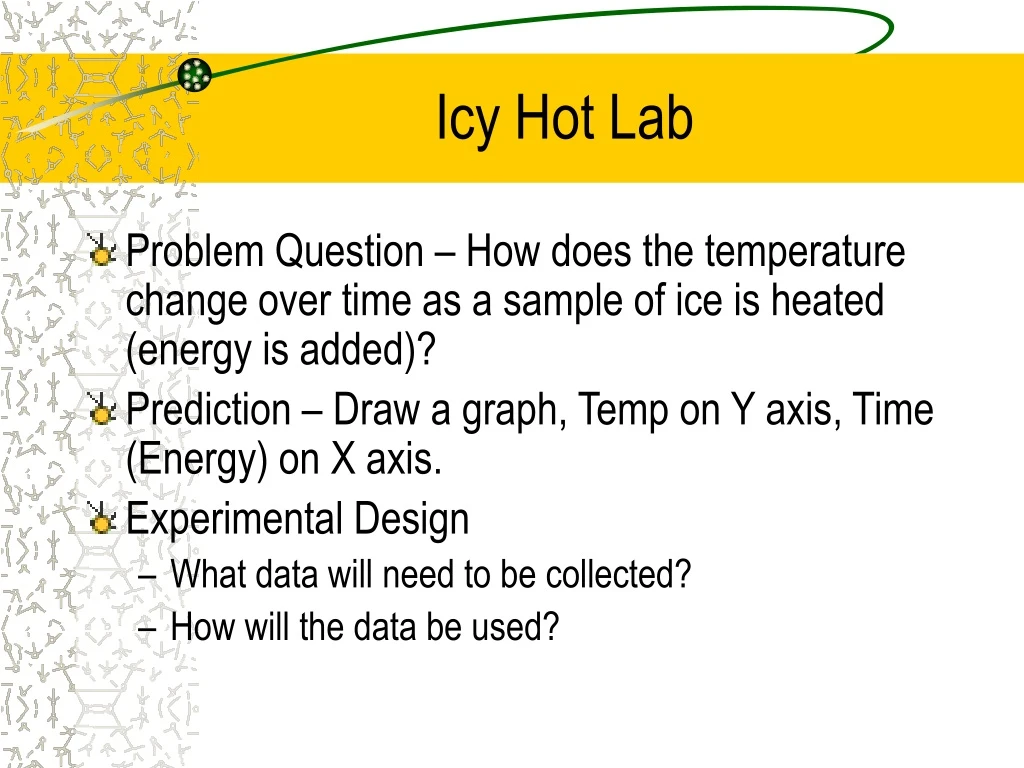
Icy Hot Lab • Problem Question – How does the temperature change over time as a sample of ice is heated (energy is added)? • Prediction – Draw a graph, Temp on Y axis, Time (Energy) on X axis. • Experimental Design • What data will need to be collected? • How will the data be used?
Icy Hot Continued • Qualitative Data – physically describe what it looks like. • Quantitative Data –Record when and at what temp ice is done melting and when it starts boiling. • Graph – Make a sketch of your graph, including temperature for the flat portions of your graph. • Answer conclusion questions BELOW graph.
Lab Write-up – Evaluation & Conclusion 1. Did the system (the H2O) in this lab involve a physical or chemical change? Explain. Did the system (the H2O absorb or release energy? Explain. 2. Divide your heating curve into three regions; label each region: • (A) a low temperature plateau • (B) a region of temperature change • (C) a high temperature plateau See NEXT SLIDE for rest of Conclusion Questions
3. For each region (A,B,C) answer these on your graph, a) describe how the energy supplied by the burner or the room was stored by the system (Eth or Eph) b) state what phases were present c) draw a model at the molecular level that shows how the water molecules were behaving. 4. How would increasing the rate of heating by using two burners affect the shape of the curve?