Download
1 / 39
390 likes | 403 Vues
Learn about the federal budget process, fiscal stimulus, and the supply-side effects of fiscal policy on employment, potential GDP, and economic growth rate.

E N D
16 Fiscal Policy CHAPTER CHECKLIST When you have completed your study of this chapter, you will be able to • 1Describe the federal budget process and the recent history of tax revenues, outlays, deficits, and debts. • 2 Explain how fiscal stimulus is used to fight a recession. • 3 Explain the supply-side effects of fiscal policy on employment, potential GDP, and the economic growth rate.
16.1 THE FEDERAL BUDGET • The federal budgetisan annual statement of the revenues, outlays, and surplus or deficit of the government of the United States. • The federal budget has two purposes: • To finance the activities of the federal government • To achieve macroeconomic objectives • Fiscal policy is the use of the federal budget to achieve the macroeconomic objectives of high and sustained economic growth and full employment.
16.1 THE FEDERAL BUDGET • The Institutions and Laws • The President and the Congress make the budget and develop fiscal policy on a fixed annual time line. • Fiscal year is the year that begins on October 1 and ends on September 30 of the next year.
16.1 THE FEDERAL BUDGET • Budget Balance and Debt • Budget balance = Tax revenues – Outlays • The government has a balanced budget when tax revenues equal outlays (budget balance is zero). • The government has a budget surplus when tax revenues exceed outlays (budget balance is positive). • The government has a budget deficitwhen outlays exceed tax revenues (budget balance is negative).
16.1 THE FEDERAL BUDGET • The government borrows to finance a budget deficit and repays its debt when it has a budget surplus. • The amount of debt outstanding that arises from past budget deficits is called national debt. • Debt at end of 2017 = Debt at end of 2016 + Budget deficit in 2017.
16.1 THE FEDERAL BUDGET • The Federal Budget in Fiscal 2017
16.1 THE FEDERAL BUDGET • On the tax revenues side of the budget: • The largest item is personal income taxes―taxes that people pay on wages and salaries and on interest. • The second largest item is Social Security taxes―taxes paid by workers and employers to fund Social Security benefits. • Corporate income taxes, which are the taxes paid by corporations on their profits, are much smaller. • Indirect taxes, the smallest revenue source, are sales taxes and customs and excise taxes.
16.1 THE FEDERAL BUDGET • On the outlays side of the budget: • The largest item is transfer payments. • Transfer payments are Social Security benefits, Medicare and Medicaid benefits, unemployment benefits, and other cash benefits paid to individuals and firms. • Expenditure on goods and services includes the government’s defense and homeland security budgets. • Debt interest is the interest on the national debt.
16.1 THE FEDERAL BUDGET • A Fiscal Policy Challenge • The U.S. government has run a budget deficit and piled up debt for most of the past 40 years. • That debt is going to keep growing as deficits become harder to avoid. • The source of the problem is the age distribution of the U.S. population.
16.1 THE FEDERAL BUDGET • There are 77 million “baby boomers” in the United States and the first of them started to collect Social Security pensions in 2008 and became eligible for Medicare in 2011. • By 2030, all baby boomers will be supported by Social Security and Medicare and benefit payments will have doubled. • The government’s Social Security obligations are a debt. How big is this debt? Who will bear its burden?
16.1 THE FEDERAL BUDGET • JagadeeshGokhale estimates that the Social Security and Medicare fiscal imbalance was $68 trillion in 2014 (i.e. the present value of debt – income). • To put the $68 trillion in perspective, note that U.S. GDP in 2014 was $17 trillion. So the fiscal imbalance was 4 times the value of one year’s production. • And the fiscal imbalance grows every year by an amount that in 2014 was approaching $2 trillion. • How can the government meet these obligations?
16.1 THE FEDERAL BUDGET • The government has four alternatives: • Raise income taxes • Raise Social Security taxes • Cut Social Security benefits • Cut other federal government spending • A fiscal imbalance must eventually be corrected and when it is, people either pay higher taxes or receive lower benefits. The concept of generational imbalance tells us who will pay.
16.2 FISCAL STIMULUS • Fiscal Policy and Aggregate Demand • Fiscal stimulus is either (i) an increase in government consumption expenditures (G), or (ii) increase in transfer payments, or (iii) decrease in taxes, or (iv) a combination of all of the above. The goal is to increase the aggregate demand: • Lower taxes or higher transfer payments increase disposable income and intended to boost consumption.
16.2 FISCAL STIMULUS • Schools of Thought and Cracks in Today’s Consensus • The three main schools of macroeconomic thought are classical, Keynesian, and monetarist macroeconomics. • Keynesiansare in favor of fiscal stimulus, believing that the multiplier is high, and thus it is effective tool to fight recessions. • Others are against fiscal stimulus because (i) multiplier is small (ii) government expansion crowds out private consumption and investment, (iii) debt burden on future generations.
16.2 FISCAL STIMULUS • Most of fiscal stimulus is automatic (not discretionary) • Automatic fiscal policyis a fiscal policy action that is triggered by the state of the economy and existing laws. • Discretionary fiscal policyis a fiscal policy action that is initiated by an act of Congress (new laws and bills).
16.2 FISCAL STIMULUS Successful fiscal stimulus Potential GDP is $16 trillion, real GDP is $15 trillion, and … 1.There is a $1 trillion recessionary gap. 2. An increase in government expenditure or a tax cut increases expenditure by ∆E.
16.2 FISCAL STIMULUS 3. The multiplier increases induced expenditure. The AD curve shifts rightward to AD1. The price level rises to 105, real GDP increases to $16 trillion, and the recessionary gap is eliminated.
16.2 FISCAL STIMULUS • Limitations of Discretionary Fiscal Policy • The use of discretionary fiscal policy is seriously hampered by four factors: • Lawmaking time lag • Shrinking area of lawmaker discretion • Estimating potential GDP • Economic forecasting
16.2 FISCAL STIMULUS • Lawmaking Time Lag • The amount of time it takes Congress to pass the laws needed to change taxes or spending. • Members of Congress often disagree on spending and taxes. Long debates and committee meetings are needed to reconcile conflicting views.
16.2 FISCAL STIMULUS • Shrinking Area of Lawmaker Discretion • Around 80 percent of the federal budget is effectively off limits for discretionary fiscal policy action. That includes expenditure on the military and on homeland security and very large expansion in expenditure on entitlement programs such as Medicare. • The 20 percent that is available for discretionary change include items such as education and the space program, which are hard to cut.
16.2 FISCAL STIMULUS • Estimating Potential GDP • It is not easy to tell whether real GDP is below, above, or at potential GDP. • So a discretionary fiscal action might move real GDP away from potential GDP instead of toward it. • This problem is a serious one because too much fiscal stimulation brings inflation and too little might bring recession.
16.2 FISCAL STIMULUS • Economic Forecasting • Fiscal policy changes take a long time to enact in Congress and yet more time to become effective. • So fiscal policy must target forecasts of where the economy will be in the future. • Economic forecasting has improved enormously in recent years, but it remains inexact and subject to error. • So for a second reason, discretionary fiscal action might move real GDP away from potential GDP and create the very problems it seeks to correct.
16.2 FISCAL STIMULUS • Another Effect Fiscal Stimulus • Often a fiscal stimulus introduces a bill, which is supposed to be temporary (during recession), but become permanent for political reasons. • It is difficult, politically, to repeal a bill that benefits a certain group of voters.
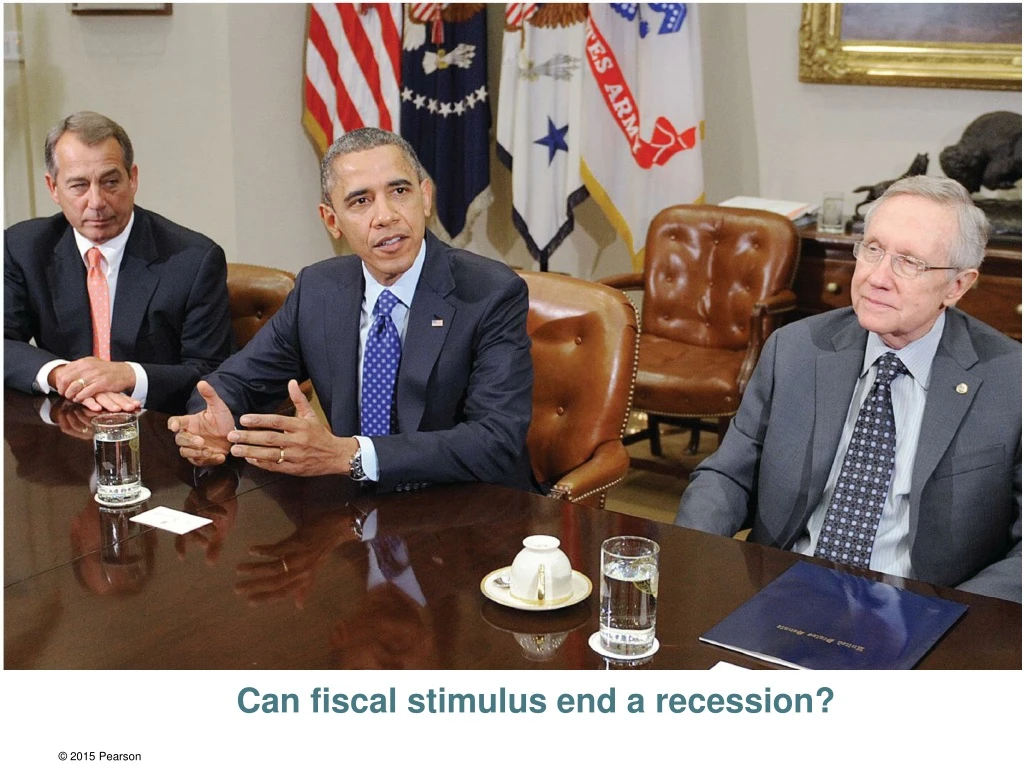
In February 2009, in the depths of the 2008–2009 recession, Congress passed the American Recovery and Reinvestment Act, a $787 billion fiscal stimulus package. This Act of Congress is an example of discretionary fiscal policy. Did this action by Congress contribute to ending the 2008–2009 recession and making the recession less severe than it might have been? The Obama Administration economists are confident that the stimulus package made a significant contribution to easing and ending the recession.
But many, and perhaps most, economists don’t agree. They think that the stimulus package played a small role and that the truly big story is not discretionary fiscal policy but the role played by automatic stabilizers. What were the fiscal policy actions and their likely effects? Discretionary Fiscal Policy President Obama promised that fiscal stimulus would save or create 650,000 jobs by the end of the 2009 summer. In October 2009, the Administration economists declared that the fiscal stimulus had saved or created the promised 650,000 jobs.
This claim of success might be correct, but it isn’t startling and it isn’t a huge claim. Why? How much GDP would 650,000 people produce? In 2009, each employed person produced $100,000 of real GDP on average. So 650,000 people would produce $65 billion of GDP. But only 20 percent of the $787 billion stimulus package had been spent (or taken in tax breaks), so the stimulus was only about $160 billion. If government outlays of $160 billion created $65 billion of GDP, the multiplier was 0.4 (65/160 = 0.4).
This multiplier is much smaller than the 1.6 that the Obama economists say will eventually occur. They believe, like Keynes, that the multiplier starts out small and gets larger over time as spending plans respond to rising incomes. An initial increase in expenditure increases aggregate expenditure. But the increase in aggregate expenditure generates higher incomes, which in turn induces greater consumption expenditure.
Automatic Fiscal Policy Government revenue is sensitive to the state of the economy. When personal incomes and corporate profits fall, income tax revenues fall too. When unemployment increases, outlays on unemployment benefits and other social welfare benefits increase. These fiscal policy changes are automatic. They occur with speed and without help from Congress.
In 2009, real GDP fell to 6 percent below potential GDP—a recessionary gap of $800 billion. Tax revenues crashed and transfer payments skyrocketed. The figure shows that the automatic stabilizers were much larger than the discretionary actions. Automatic action played the major role in limiting job losses.
16.3 THE SUPPLY SIDE: POTENTIAL GDP AND GROWTH • Besides aggregate demand, fiscal policy also influences potential GDP and the growth rate of potential GDP. • These influences on potential GDP and economic growth arise because • The government provides public goods and services that increase productivity and • Taxes change the incentives the people face.
16.3 THE SUPPLY SIDE: POTENTIAL GDP AND GROWTH • Supply-side effects are the effects of fiscal policy on potential GDP. • Supply-side effects operate more slowly than the demand-side effects. • Supply-side effects are often ignored in times of recession when the focus is on fiscal stimulus and restoring full employment. • But in the long run, the supply-side effects of fiscal policy dominate and determine potential GDP.
16.3 THE SUPPLY SIDE: POTENTIAL GDP AND GROWTH • Fiscal Policy, Employment, and Potential GDP • Both sides of the government's budget influences potential GDP. • Public Goods and Productivity • Public goods include roads and other infrastructure, public schools, police, national defense, etc. It is argued that investment in public goods increases productivity. • The increase in productivity increases potential GDP.
16.3 THE SUPPLY SIDE: POTENTIAL GDP AND GROWTH • Taxes and Incentives • Lower taxes on labor income incentivize workand employment, and increase potential GDP.
16.3 THE SUPPLY SIDE: POTENTIAL GDP AND GROWTH • Taxes, Deficits, and Economic Growth • Fiscal policy influences economic growth in two ways: • Taxes drive a wedge between the interest rate paid by borrowers and the interest rate received by lenders, discouraging saving and investment. • 2. If there is a budget deficit, government borrowing to finance the deficit competes with firms’ borrowing to finance investment and to some degree, government borrowing “crowds out” private investment.
16.3 THE SUPPLY SIDE: POTENTIAL GDP AND GROWTH • Long-Run Fiscal Policy Effects • The long-run consequences are the most profound ones. • If investment is crowded out by a large budget deficit, the economic growth rate slows and potential GDP gets ever farther below what it might have been as the Lucas wedge widens. • If a large budget deficit persists, debt increases, confidence in the value of money is eroded, and inflation erupts. • It is vital that government outlays and budget deficits be kept under control.
16.3 THE SUPPLY SIDE: POTENTIAL GDP AND GROWTH • Public Debt and Deficits Around the World Public Debt (% of GDP) Government Deficit (% of GDP) The American Presidency Project (Political Party Platforms of Parties Receiving Electoral Votes 1840 – 2016).


