NWS Weather Forecasting and Analysis Overview
660 likes | 723 Vues
Explore the National Weather Service's forecasting process, including NWP models and data assimilation. Learn how meteorologists predict weather using various methods. Get insights into gridded analyses, numerical models, and the importance of observations. Dive into the complex world of weather forecasting with this informative overview.

NWS Weather Forecasting and Analysis Overview
E N D
Presentation Transcript
The National Weather Service • The National Weather Service (NWS) is responsible for forecasts several times daily • Different weather forecast offices (WFOs) are responsible for their specific region • WFOs are also responsible for warnings in their specific region • NWS forecasters rely heavily on the Advanced Weather Information Processing System (AWIPS) to understand current conditions and make forecasts • See: nws.noaa.gov
The National Weather Service • A variety of products are created at NWS WFOs • Short-term forecasts • 7-day zone forecasts • Aviation forecasts • Marine forecasts • Hydrological forecasts (river heights) • Forecast discussions Current Lubbock forecast discussion and 7-day zone forecast…
The easy way to forecast… • Persistence – the weather tomorrow will be like the weather today • Climatology – the weather tomorrow will be like the climate average for tomorrow • Trend – whatever is upstream in the wind field will impact our location in the same way an upstream location was impacted: nowcasting • Analog – the weather is change in the same way the weather in a historic, similar case changed
Trend Forecasting The “let’s just move this downwind” method. Fig 13-3, p 404
Analog • The “What does an fill-in-the-blank system normally do if the jet stream looks like this?” method • Can be a great starting point, but the atmosphere is chaotic = small changes in conditions result in large changes in the forecast Fig 13-4, p 404
The Forecasting Process • Forecasts from now out to a few hours is called nowcasting • Strongly based on observations (radar, satellite images, surface observations) • Forecasts beyond about 6 hours is based mostly on numerical weather prediction (NWP) models
Numerical Weather Prediction • Numerical weather models operate in 3 main phases: 1) Analysis 2) Prediction 3) Post-processing
Numerical Weather Prediction – The Analysis Phase • A gridded, 3-dimensional analysis is produced with 1) A previous forecast 2) Observations • The process by which the above are combined is called data assimilation
Data Assimilation • Gridded atmospheric analyses are produced by combining the following: • A previous forecast – from model • Forecast uncertainty – what are the mathematical / computational errors of the model? • Observations – satellite, direct surface / upper air observations (surface stations, aircraft, radiosondes, buoy, etc), radar • Observation uncertainty – what are the errors of the instruments?
Data Assimilation • Temperature at a single point (Lubbock): Previous forecast from model Observation T = 86oF Terror = 10oF T = 80oF Terror = 1oF
Data Assimilation • Temperature at a single point (Lubbock): Previous forecast from model Observation T = 86oF Terror = 10oF T = 80oF Terror = 1oF Analysis T = 81oF
Data Assimilation • Temperature at a single point (Lubbock): Previous forecast from model Observation T = 86oF Terror = 1oF T = 80oF Terror = 10oF Analysis T = 85oF
Data Assimilation • Temperature at a single point (Lubbock): Previous forecast from model Observation T = 86oF Terror = 5oF T = 80oF Terror = 5oF Analysis T = 83oF
Data Assimilation • The resulting analysis is the most likely state of the atmosphere based on the given information • Remember: Observations have lots of gaps spatially/temporally, so we need to use the model state in order to better approximate the entire atmosphere.
Data Assimilation • There are a variety of different modern methods of data assimilation 1) Three-dimensional variational data assimilation (3DVAR) 2) Four-dimensional variational data assimilation (4DVAR) 3) The ensemble Kalman filter (EnKF)
Numerical Weather Prediction – The Prediction Phase • The prediction phase of NWP involves calculating the future state of the atmosphere at each grid point (starting point = the analysis) under the following governing equations: 1) Conservation of momentum 2) Conservation of mass 3) Conservation of energy Example: = d(wind) Sum of forces impacting the wind dt
Grid Points • Varies per model (not all models use grids either) • Less spacing = higher resolution = more computation time Fig 13-9, p 414
Numerical Weather Prediction – The Prediction Phase • NWP takes massive amounts of computing power!!! 1980s: U.S. nested grid model – 80-km resolution over continental U.S. (48-hr forecast runtime = hours) Today: Weather Research and Forecasting model – 12-km resolution over U.S. (48-hr forecast runtime = 10 minutes)
Numerical Weather Prediction – The Prediction Phase • NWP can be classified in 2 ways: 1) Deterministic – a single forecast is produced and relied upon 2) Probabilistic – many forecasts are produced and forecast probabilities can be generated (ensemble forecasting)
Deterministic vs. Probabilistic Forecasting Time = 00-hr
Deterministic vs. Probabilistic Forecasting Time = 00-hr Time = 72-hr
Probabilistic Forecasting 10-day forecasts
Probabilistic Forecasting • Main challenge = Expressing uncertainty to the public in a way it will be useful - Do people want to hear what the high temperature will be, or do they want to know the possible range of high temperatures? What does it mean to have a 50% chance of rain, anyway?
The Prediction Phase – How Can Forecasts Go Bad? • There are 2 main sources of error in NWP forecasts: 1) Initial condition error – errors in the analysis of a NWP model 2) Physics errors – physics that are wrong in the NWP model (mostly associated with surface processes) Some of our equations do not have solutions!
Initial Condition Error • Initial condition errors are always present in NWP analyses • Because of chaos, errors in the analysis will eventually grow to be large (forget about 45-day forecasts!) • Whether or not initial condition error matters to short-range (0-72hr) forecasts is another question…
Initial Condition Error L Sensitivity of 24-hr cyclone position to SLP
Physics Errors • The physics in NWP models aren’t perfect - Surface radiation processes - Frictional turbulence of surface winds - Convection - Cloud processes
Physics Errors • Physics errors often lead to model biases – consistent errors in certain model variables (e.g. surface temperature) - Documented biases of nested grid model…
Recap • Persistence forecast – uses repeat of today’s weather • Climatology forecast – uses average weather for a given day of the year • Trend forecast – uses direct advection of upstream weather • Analog forecast – uses historic, similar case • Nowcasting – forecasting immediate weather changes (few hours), observation based • Numerical Weather Prediction – computer models, solutions of governing equations
NWP • Analysis • Combination of previous forecast and observations (data assimilation) • Tries to find the most likely state of the atmosphere • Prediction • Solutions to equations at grid points • High use of computing power • Deterministic: single forecast • Probabilistic: many deterministic forecasts ran, ensemble (mean and probabilities) used, expresses the uncertainty of the analysis and the solution • Errors: initial conditions and physics of the model
Numerical Weather Prediction – The Post-processing Phase • The post-processing phase of NWP involves creating graphics of the forecast: 1) 500-mb height 2) SLP 3) Surface wind 4) 3-hr precipitation 5) 1000-500mb thickness
NWP Post-processing • The final forecast product includes the human factor – judgments based on both a forecaster’s experience and NWP
NWP Post-processing • Model Output Statistics (MOS) – a post-processing technique that correlates relationships between a model forecast and reality over many, many forecasts • MOS produces a forecast incorporating these statistical relationships - really good for common situations and models which haven’t changed in years, really bad for unusual events
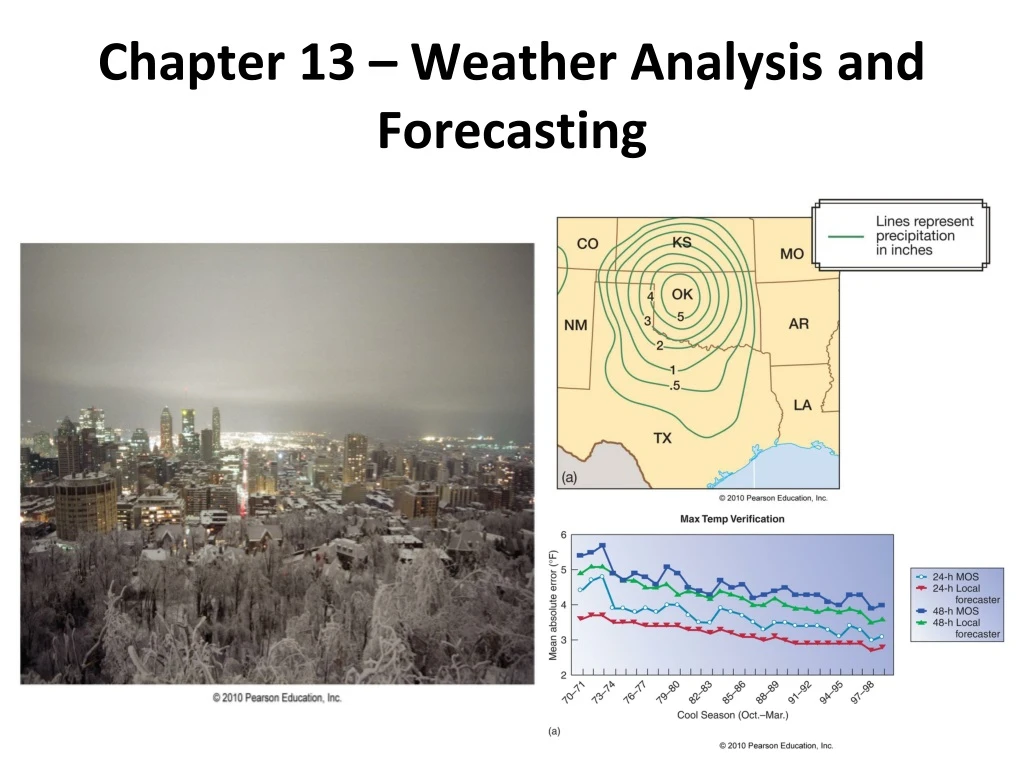
Forecast Verification • Forecast verification is the process of measuring the skill of a forecast (model, human forecaster, MOS…)
Forecast Verification • Forecast verification is the process of measuring the skill of a forecast (model, human forecaster, MOS…)
Long-range Forecasts • The Climate Prediction Center (CPC) is responsible for forecasts valid more than 1 week into the future (numerical models and statistics) • Seasonal forecasts are also made by the CPC that indicate above or below probabilities of warm/cold or wet/dry seasons CPC predictions for 2016…
Weather Analysis • Forecaster awareness is a major aspect of forecasting, and focuses on knowing the current atmospheric conditions using: 1) Observations (radar, satellite, radiosondes, surface station obs) 2) Weather maps - Surface - Aloft (850, 700, 500, 300mb) • Why? • Better idea of what is actually happening in the atmosphere • What is the model overlooking? Is there anything too small for the model to reproduce?
Observations • 4 main observation types help forecasters familiarize themselves with current weather conditions: 1) Satellite images 2) Radar images 3) Thermodynamic diagrams from radiosondes 4) Surface station plots
Satellite Images Visible Satellite Imagery
Satellite Images Infrared Satellite Imagery
Satellite Images Water Vapor Satellite Imagery


