Sequence analysis
Sequence analysis. June 20, 2006 Learning objectives-Understand sliding window programs. Understand difference between identity, similarity and homology. Understand difference between global alignment and local alignment. Review amino acids structures.

Sequence analysis
E N D
Presentation Transcript
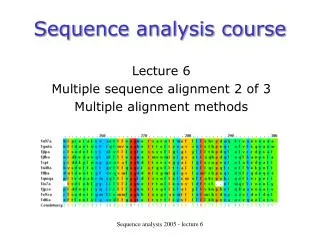
Sequence analysis • June 20, 2006 • Learning objectives-Understand sliding window programs. Understand difference between identity, similarity and homology. Understand difference between global alignment and local alignment. Review amino acids structures. • Workshop-Perform sliding window to compute %G+C as a function of position in sequence.
4 GCATATGCGCATATCCCGTCAATACCA 5 GCATATGCGCATATCCCGTCAATACCA 6 GCATATGCGCATATCCCGTCAATACCA Sliding window (1) This refers to the number of characters looked at, during one particular time. Below is a sequence shown three times with different window lengths
Sliding window (2) A "window" can be defined as a span of a certain number of residues (nucleotides or amino acids). One calculates some value for the residues in that window. Once the calculation is completed, the program shifts the window and the process repeats itself until the end of the sequence is reached. A simple example is to calculate the %G+C content within a window. Then move the window one nucleotide and repeat the calculation.
Sliding window (3) If the window is too small it is difficult to detect the trend of the measurement. If too large you could miss meaningful data. Small window size %G+C Number in sequence Large window size %G+C Number in sequence
Sliding window (4) From: Segurado et al., 2003
A T G C C T A G * * A T G C C T A G * * * * * * * * * * * * * * Dot Plots Window = 1 Note that 25% of the table will be filled due to random chance. 1 in 4 chance at each position
Dot Plots with window = 2 A T G C C T A G Window = 2 The larger the window the more noise can be filtered What is the percent chance that you will receive a match randomly? One in (four)2chance. 1/16 * 100 = 6.25% * A T G C C T A G { * { * { * { * { * { * {
Chou-Fasman-the first sliding window programs to predict protein secondary structure • First widely used procedure • If propensity in a window of six residues (for a helix) is above a certain threshold the helix is chosen as secondary structure. • If propensity in a window of five residues (for a beta strand) is above a certain threshold then beta strand is chosen. • Each classification is extended until the average propensity in a 4 residue window falls below a value. • Output-helix, strand or turn.
Chou-Fasman Rules (Mathews, Van Holde, Ahern) Amino Acid -Helix -Sheet Turn Ala 1.29 0.90 0.78 Cys 1.11 0.74 0.80 Leu 1.30 1.02 0.59 Met 1.47 0.97 0.39 Glu 1.44 0.75 1.00 Gln 1.27 0.80 0.97 His 1.22 1.08 0.69 Lys 1.23 0.77 0.96 Val 0.91 1.49 0.47 Ile 0.97 1.45 0.51 Phe 1.07 1.32 0.58 Tyr 0.72 1.25 1.05 Trp 0.99 1.14 0.75 Thr 0.82 1.21 1.03 Gly 0.56 0.92 1.64 Ser 0.82 0.95 1.33 Asp 1.04 0.72 1.41 Asn 0.90 0.76 1.23 Pro 0.52 0.64 1.91 Arg 0.96 0.99 0.88 Favors -Helix Favors -Sheet Favors Turns
Chou&Fasman structure prediction Chou & Fasman [Biochemistry 13(2):222-245 (1974)]. By studying a number of proteins whose structures were known, they were able to determine stretches of amino acids that could serve to form an a-helix or a b-sheet. These amino acids are called helix formers or sheet formers and can have different strengths for forming their structures. Once these nucleation sites are determined, adjacent amino acids are examined to see if the structure can be extended in either or both directions. Values for some amino acids allow extension, other amino acids do not. Some amino acids are categorized as helix breakers, or sheet breakers. A string of these will terminate the current structure. This method is about 60-65% accurate.
5 7 4 6 1 2 3 Kyte-Doolittle Hydropathy – Another sliding window routine [J. Mol. Biol. 157:105-132 (1982)]. They determine a "hydropathy scale" for each amino acid based on empirical observations.
Evolutionary Basis of Sequence Alignment 1. Identity: Quantity that describes how much two sequences are alike in the strictest terms. 2. Similarity: Quantity that relates how much two amino acid sequences are alike. 3. Homology: a conclusion drawn from data suggesting that two genes share a common evolutionary history.
Purpose of finding differences and similarities of amino acids in two proteins. • Infer structural information • Infer functional information • Infer evolutionary relationships
Modular nature of proteins (cont. 1) Exon 1a Exon 2a Gene A Duplication of Exon 2a Exon 1a Gene A Exon 2a Exon 2a Exchange with Gene B Exon 1b Gene B Exon 2b Exon 2b Exon 3 (Exon 2b from Gene B) Exon 2a Exon 1a Gene A Exon 1b Exon 3 (Exon 2a from Gene A) Gene B Exon 2b
Evolutionary Basis of Sequence Alignment (Cont. 1) Why are there regions of identity? 1) Conserved function-residues participate in reaction. 2) Structural (For example, conserved cysteine residues that form a disulfide linkage) 3) Historical-Residues that are conserved solely due to a common ancestor gene.
One is mouse trypsin and the other is crayfish trypsin. They are homologous proteins. The sequences share 41% identity.
Evolutionary Basis of Sequence Alignment (Cont. 2) Note: it is possible that two proteins share a high degree of similarity but have two different functions. For example, human gamma-crystallin is a lens protein that has no known enzymatic activity. It shares a high percentage of identity with E. coli quinone oxidoreductase. These proteins likely had a common ancestor but their functions diverged. Analogous to railroad car and diner function.
Modular nature of proteins • The previous alignment was global. However, many proteins do not display global patterns of similarity. Instead, they possess local regions of similarity. • Proteins can be thought of as assemblies of modular domains. THINK OF MR. POTATOHEAD. It is thought that this may, in some cases, be due to a process known as exon shuffling.
Identity Matrix A 1 C 0 1 I 0 0 1 L 0 0 0 1 A C I L Simplest type of scoring matrix
Similarity It is easy to score if an amino acid is identical to another (the score is 1 if identical and 0 if not). However, it is not easy to give a score for amino acids that are somewhat similar. CO2- CO2- +NH3 +NH3 Isoleucine Leucine Should they get a 0 (non-identical) or a 1 (identical) or Something in between?
Two proteins that are similar in certain regions Tissue plasminogen activator (PLAT) Coagulation factor 12 (F12).
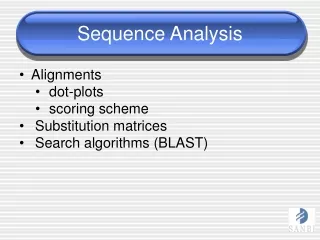
The Dotter Program • Program consists of three components: • Sliding window • A table that gives a score for each amino acid match • A graph that converts the score to a dot of certain density. • The higher the density the higher the score.
Single region on F12 is similar to two regions on PLAT Region of similarity