Download
1 / 24
240 likes | 391 Vues
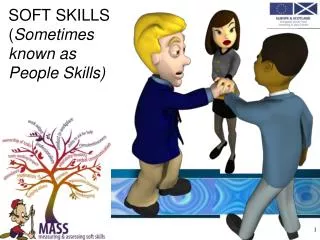
Interpreting the People Skills Report. Why a multi-rater?. Helps you understand others’ perceptions of your behavior. These are neither “right” or “wrong”—they are what people use to decide how to work with you

E N D
Why a multi-rater? • Helps you understand others’ perceptions of your behavior. These are neither “right” or “wrong”—they are what people use to decide how to work with you • Identifies specifically what is likely to increase your influence and effectiveness. • Provides insight into how to leverage your strengths and address potential derailers.
Considerations • Behavior Derailers are evident when an important behavior is overplayed or ineffectively displayed. • A strength Overdone becomes “noise” for leaders and typically reflects a lack of flexibility or a need for learning agility. • Knowing variations in perceptions between groups deepens awareness of impact on others.
PeopleSkills Assessment • Based on fifty years of research on behaviors that matter at work and at home. • Allows raters to identify importance, frequency, and effectiveness of behaviors. • Provides an opportunity for examples and illustrations. • Does “heavy lifting” in analyzing your data through the use of various grids and summaries.
Three Dimensions • FREQUENCY: Infrequent behaviors may need to be increased; Very frequently demonstrated behaviors may need to be turned down. • IMPORTANCE: Not every behavior is critical to success at a given time or for a position. Knowing what each group feels is important helps clarify targets for performance. • EFFECTIVENESS: Indicates behavior that needs to be developed.
Make sure this is your report. Scoring Date is important. Raters completing after that date are not included.
Your report has 11 sections. Each section is designed to help you both understand your data or to apply the insights.
Raters were asked to rate: How Frequently you demonstrate a behavior. How Important a behavior is to your success. How Effective your behavior seems to them.
You are going to get numerical data which shows the averages of your raters for each behavior across all three dimensions: Frequency, Importance, and Effectiveness. You will get graphical data using bar graphs and colors to show you the relative intensity of your ratings.
Two important considerations in looking at your data are the number of raters in each category (e.g. Boss, Peer, Direct Reports, etc)and how much contact they feel they currently have with you.
For each kind of rating—Frequency, Importance, and Effectiveness– you have a summary report. The summary report lists the scores from highest to lowest, providing both a graphical bar and the average of all raters (minus yourself). The numbers in ( ) are associated with chapters from the PEOPLE SKILLS HANDBOOK: Actions Tips for Improving Your Emotional Intelligence.
Each Summary graph also uses colors to lists the rating averages in terms of groups of 25%. The TOP 25% are gold. The second 25% from the top are green. The third 25% from the top are rated yellow. The bottom 25% are rated red.
Your group averages are provided. Using the same listing in order of highest overall average to least, you get the scores for Frequency, Importance, and Effectiveness in separate summaries. You can quickly look for patterns within each rater group and across rater groups. If a “5” was given, raters were asked if the behavior was “Over Done.” A (!) indicates an Over Done designation. * Indicates a 3 point spread in a rater group
Averages Up Close Look at data patterns WITHIN a column to see Observer Trends. Does the observer group have a wide or limited range of scores? Look at data patterns ACROSS categories to see behavior confirmations. Are the lows or highs similar across different groups? Consider the number and content patterns associated with (!) or (*) designations. Is there consistent kinds of items with a three point spread or perceived overused behaviors.
To assist your analysis of the data, your overall ratings are provided on three graphs. Each graph compares one of the following: Frequency and Effectiveness Effectiveness and Importance Frequency and Importance Ordering the ratings by groups of top to bottom 25%, you can see how the skills are viewed.
The graphs also use a coloring system to alert you to relative importance of the information. Green means the skills are viewed favorably. Mauve means the skills need attention (e.g. do more, enhance). Yellow means the skills need review. White means the skills are worth noting but are not apparently important at the moment.
Your Blind Spot report is based on a 1 point difference between your self rating and the average ratings for each group. If you rated yourself higher than your raters, it may be a Blind Spot.
Your Hidden Strengths report is based on a 1 point difference between your self rating and the average ratings for each group. If you rated yourself lower than your raters, it may be a Hidden Strength.
The People Skills Library has 54 skills which may be used in your multi-rater. Usually, organizations use a subset of the People Skills Library to enhance focus on those skills that are mission critical. Of the People Skills used in your report, you can see which are “golden” and which are “red” areas needing attention.
Raters are encouraged to provide examples and illustrations related to your strengths, barriers to effectiveness, and suggested advice for greater effectiveness.
A planning worksheet is provided to assist your analysis across ratings of Frequency, Importance, and Effectiveness. These are guidelines and are intended to support narrowing your focus to those skills areas that will provided the most important outcomes for you.
A Goal Planning form provides you with a step-by-step way to tackle a development need. You are encouraged to identify the Benefits of reaching the goal, the Obstacles to achieving the goal, and the Resources you need. A step-by-step plan is encouraged.
In the event that you are also using the PEOPLE SKILLS HANDBOOK: ACTION TIPS FOR IMPROVING YOUR EMOTIONAL INTELLIGENCE, you will find these page references useful. You can see action tips to help you reach your goal.
Thanks • Thanks for using the People Skills assessment. • Questions or comments are invited at: info@leadership-systems.com.