High-Speed Rail at Amtrak
240 likes | 532 Vues
High-Speed Rail at Amtrak. Frank Vacca, Chief Engineer June 24, 2011. Rail Resurgence. Record ridership Record revenues 19 months of month over month improvement Fuel costs climbing Favorable transportation and energy policies HSR excitement. HSR Opportunities in America.

High-Speed Rail at Amtrak
E N D
Presentation Transcript
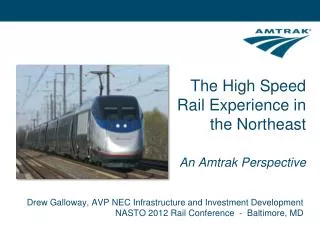
High-Speed RailatAmtrak Frank Vacca, Chief Engineer June 24, 2011
Rail Resurgence • Record ridership • Record revenues • 19 months of month over month improvement • Fuel costs climbing • Favorable transportation and energy policies • HSR excitement
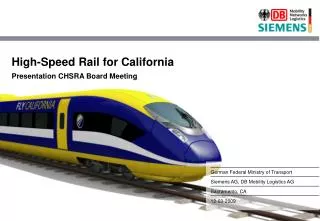
HSR Opportunities in America • Florida – Project Cancelled • California • 220 mph – 800 mile network • $3.5B in HSIPR grants – ($45B investment) • Midwest (Midwest Regional Rail Initiative) • $1.1B grant - St. Louis-Chicago line (110 mph) • Northeast Corridor (NEC) Operating Today • Next Gen-HSR plan • Stair-step approach
2nd largest mega-region in the world Economic and political capital of the Americas Population density =/> Europe and 12 times US average 457 route miles 12 states, DC 8 commuter operators Class 1 and regional freight Amtrak high speed, regional, long-distance Northeast Corridor – Regional Overview 50 million people (Northeast megaregion) • 8 airports • 12 ports
NEC Master Plan • NEC Commission sponsored: • NEC Master Plan ($52 Billion) - Goals • Corridor to state-of-good repair • 2030 planning horizon • Maximize capacity and travel times in corridor • Continued shared-use railway operation (freight, commuter, regular and high-speed) • Travel Times 2:42 NYC - DC 2:15 3:35 NYC - BOS 3:08 Existing Master Plan (2030)
Northeast Corridor - 2030 • By 2030 Under NEC Master Plan • Capacity exceeded • Limited ability to: • Increase service • Lower travel times • Attract New Riders • NEC intercity travel demand will double by 2050 • Other NEC modes have limited growth potential • Corridor needs new capacity to compete in worldwide economy Amtrak Ridership Growth Under Master Plan +8% +10% +33% Capacity-Constrained Growth +35% 16
Amtrak Next Gen HSR Vision • World-Class High-Speed Network • Dedicated 2-track alignment • 220 mph equipment • 40% - 60% travel-time reductions in key markets • Boston–Washington DC: from 6:30 to 3:20 2:42 NYC - DC 2:15 1:36 3:35 NYC - BOS 3:08 1:24 Next-GenHSR Plan Existing Master Plan (2030)
Amtrak Next Gen HSR Vision • Infrastructure • Dedicated 2-track system • Minimum 4 tracks at stations (turns & passing moves) • Heavy use of tunnels & structures to meet alignment requirements, minimize impacts • Rolling Stock • Similar to Acela but 8 vs. 6 cars • 400-passenger capacity • Speeds up to 350 kph • EMU-style distributed power, bi-level consists also possible
Potential Alignments: NY to BOS • Challenges • Boston to New York alignment poses difficult challenges • Capacity limits on New Haven Line • Curvature, capacity and environmental concerns on Shore Line (New Haven to MA state line) • Analyzed Alignment • Diverges north of New Rochelle to serve CT and RI • Converges with NEC alignment at Rt. 128 station in MA “Analyzed Alignment’ used for costing and analysis purposes, subject to further analysis in next phase
Potential Alignments: DC to NY • Challenges • Utilize existing NEC corridor where possible • Providing service to built-up CBD areas in key cities • Analyzed Alignment • Substantially parallels NEC • New stations in Baltimore and Philadelphia more centrally located “Analyzed Alignment’ used for costing and analysis purposes, subject to further analysis in next phase
Capital Investment Costs • $117 Billion (in $2010) • Equivalent of $4.7 Billion annually over 25 years of construction • $275 million/mile for infrastructure, stations, facilities • 55 train sets @ $51 million each • Phasing of Construction • Four phases over the 2015 to 2040 period • Phases 1-3 (2015–2030): New York to Washington • Phase 4 (2024–2040): New York to Boston
Next Gen HSR to Boston Next Gen HSR North to Hartford Next Gen HSR South to Wash D.C. Next Gen HSR MOS: NYC to PHL NEC Gateway: Newark to NYC 160 mph Service South of NYC Acela II Fleet Doubles Capacity 40% Increase in Acela Capacity NEC Stair-Steps to Next-Gen HSR Vision Full Next-Gen HSR Network Fast-Track HSR Program
“Fast-Track” Segment • Initial “Fast-Track” (2022) • “Gateway” Project from NJ into Moynihan Station • Next-Gen HSR segment Newark to Frankford Junction • Master Plan improvements Philadelphia to Washington, DC
NEC Stair-Step Approach • Additional ACELA cars 40% capacity increase • Purchase of ACELA II’s
Other NEC Approved Projects • Maryland Bridge replacement • Harold Interlocking – Amtrak bypass track • Kingston, RI - passing track construction • B&P Tunnel replacement
HSR Advantages • Safer • Fast, safe and secure rail travel • Fewer highway accidents • Greener • Reduces energy use, emissions • Supports dense, smart urban development patterns • Strengthens existing commuter and transit systems and riders • Healthier • Comfortable, convenient travel supports affordable, livable & sustainable communities • Minimize land area needed to meet future travel demand
HSR Advantages • NEC HSR System Capacity • Up to 50 million annual passengers • Up to 8,000 passengers/hr. in each direction • 2040 service plan = ~25% of capacity • Highway Equivalent • 8,000 travelers/hr. = 5,300 cars • Requires 3 highway lanes in each direction • Difference • Speed • Direct downtown-to-downtown connection • Less energy and emissions
HSR Factors • Market • Competition • Trip Time • Top speed vs Average speed • Service Frequency • Incremental vs Greenfield • Funding
Amtrak HSR Factors • Market – One of the most populated corridors in the World • Competition – Airlines • Presently have 70% NY to DC and 55% NY to Bos • Trip Time • Very sensitive – NY to DC 2hrs / NY to Bos 3hrs • High top speed necessary to meet trip time • Frequency • Critical • Incremental/Greenfield • Mixed • Funding • Varies
HSR Funding How Does Speed Influence Cost • Up to 110 mph • Wood ties • Cab signal systems/PTC • Grade crossing acceptable • Diesel acceptable • 111 to 186 mph • Concrete ties • Catenary • No grade crossings • ROW fencing • No movable bridges -/fixed high level bridges • 187 to 220+ mph • Slab Track? • Intrusion systems • Noise mitigation * Higher the speeds the tighter maintenance tolerances leading to higher maintenance costs