Download
1 / 26
260 likes | 391 Vues
The Latino population in Colorado has seen significant growth but faces substantial health disparities rooted in socioeconomic disadvantages. This discussion emphasizes the importance of health equity, defined as achieving the highest level of health for all. By addressing avoidable inequalities and systemic issues, we aim to improve health outcomes for Latino and other marginalized communities. Initiatives must focus on the social determinants of health, including access to quality healthcare, education, and economic opportunities to foster healthier communities for all.

E N D
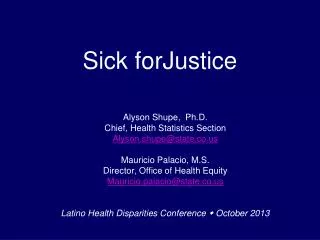
Sick forJustice Alyson Shupe, Ph.D. Chief, Health Statistics Section Alyson.shupe@state.co.us Mauricio Palacio, M.S. Director, Office of Health Equity Mauricio.palacio@state.co.us Latino Health Disparities Conference w October 2013
Health Equity • Health equity is achieving the highest level of health for all people. Health equity entails focused societal efforts to address avoidable inequalities by equalizing the conditions for health for all groups, especially for those who have experienced socioeconomic disadvantage or historical injustices. • Health equity concerns those differences in population health that can be traced to unequal economic and social conditions and are systemic and avoidable – and thus inherently unjust and unfair.
Determinants of Health Policies and Interventions PhysicalSocial Environment Individual Environment Behavior Biology Access to Quality Health Care Source: Healthy People 2010
Colorado high school graduation rates, 2011 Source: Colorado Department of Education
Colorado median household income, 2009 Source: U.S. Bureau of the Census, 2009 American Community Survey 1-Year Estimates
Source: Small Area Income and Poverty Estimates (SAIPE) , US Census Bureau
Fair or poor health by race/ethnicity, Colorado Adults, 2011 Source: Behavioral Risk Factor Surveillance System, Colorado Department of Public Health and Environment
Source: Behavioral Risk Factor Surveillance System, Colorado Department of Public Health and Environment
Example Study Area for 2013 OHD Report Demographics of those living within a selected high volume transportation corridor. Air quality within a 500’ zone adjacent to roadways is suspected of increasing certain health risks.
Obesity prevalence by race and ethnicity 2008-2012, Colorado adults Percent Source: Colorado Behavioral Risk Factor Surveillance System, Colorado Department of Public Health and Environment
Diabetes prevalence by race and ethnicity 2008-2012, Colorado adults Percent Source: Colorado Behavioral Risk Factor Surveillance System, Colorado Department of Public Health and Environment
Obesity rates of Colorado children ages 2-14 by race and ethnicity, 2005-2012 Percent Source: Colorado Child Health Survey, Colorado Department of Public Health and Environment
Smoking prevalence by race and ethnicity 2008-2012, Colorado adults Percent Source: Colorado Behavioral Risk Factor Surveillance System, Colorado Department of Public Health and Environment
Insurance coverage by race and ethnicity 2008-2012, Colorado adults Percent Source: Colorado Behavioral Risk Factor Surveillance System, Colorado Department of Public Health and Environment
Years of potential life lost Source: Vital Statistics Unit, Colorado Department of Public Heath and Environment
Unintended pregnancy rates by race and ethnicity 2007-2011 Percent Source: Colorado Pregnancy Risk Assessment and Monitoring System, Colorado Department of Public Health and Environment
Low birth weight births by race and ethnicity 2007-2012 Percent Source: Vital Statistics Unit, Colorado Department of Public Health and Environment
Infant mortality rates by race and ethnicity 2007-2012 Percent Source: Vital Statistics Unit, Colorado Department of Public Health and Environment
Colorado fertility rates for teens 15-17 years old, 1990–2011 Source: Vital Statistics Unit, Colorado Department of Public Heath and Environment
Smoking during the last 3 months of pregnancy by race and ethnicity 2007-2011 Percent Source: Colorado Pregnancy Risk Assessment and Monitoring System, Colorado Department of Public Health and Environment
Drinking during the last 3 months of pregnancy by race and ethnicity 2007-2011 Percent Source: Colorado Pregnancy Risk Assessment and Monitoring System, Colorado Department of Public Health and Environment
Latino Population Growth • 2000 – 2010: • Latino population in CO increased 41% (735,601 to 1 million) • States’ population increased 17% (4.3 million to 5 million) • Latinos represent 21% of Colorado’s population • Latinos are the second largest population group in Colorado • Nearly 31% of all Coloradans under 18 are Latino • Latino population growth presents many opportunities for increasing Latino representation in business, employment, education and politics (Paul Lopez, Denver City Councilmember). Source: NALEO Educational Fund, News Release, February 24, 2011.
Healthy Latino Communities • Healthy communities are critical to our residents’ wellbeing and a thriving Colorado economy. • For years we have mainly attributed our health to the day-to-day choices we make. • While individuals are responsible for making healthy choices, the conditions where we live, learn, work and play limit our choices and opportunities to be healthy. • We now know there are hidden health factors that impact our lives, including our education, socio-economic status and job opportunities.
So, what do we do about it? • The first step is promoting awareness and understanding of these hidden health factors. • Next, we must work in partnership with communities to bring everyone up to an optimal level of health. • Finally, we must all take actionto improve health equity and eliminate health disparities.