1 / 1

% of max. Total Coverage (of all data excluding adk )

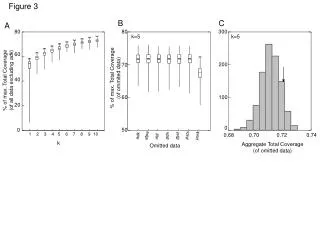
Figure 3. B. C. A. 80. 80. 300. k=5. k=5. 60. 200. 70. % of max. Total Coverage (of ommited data). % of max. Total Coverage (of all data excluding adk ). 40. 60. 100. 20. 0. 0. 50. 1. 2. 3. 4. 5. 6. 7. 8. 9. 10. 0.68. 0.70. 0.72. 0.74. psts. purk. atpa. adk.

tovah
Télécharger la présentation

% of max. Total Coverage (of all data excluding adk )

An Image/Link below is provided (as is) to download presentation Download Policy: Content on the Website is provided to you AS IS for your information and personal use and may not be sold / licensed / shared on other websites without getting consent from its author. Content is provided to you AS IS for your information and personal use only. Download presentation by click this link. While downloading, if for some reason you are not able to download a presentation, the publisher may have deleted the file from their server. During download, if you can't get a presentation, the file might be deleted by the publisher.

E N D

Presentation Transcript


  1. Figure 3 B C A 80 80 300 k=5 k=5 60 200 70 % of max. Total Coverage (of ommited data) % of max. Total Coverage (of all data excluding adk) 40 60 100 20 0 0 50 1 2 3 4 5 6 7 8 9 10 0.68 0.70 0.72 0.74 psts purk atpa adk gdh gyd ddl k Aggregate Total Coverage (of omitted data) Omitted data

More Related