Class Size Amendment Update: Compliance and Transfer Calculations (February 2004)
270 likes | 397 Vues
This update presents the latest data on district compliance with class size averages and transfer calculations based on the 2004 amendment. Key highlights include K-3 class size caps, with 72% of students currently in classrooms exceeding these limits. Additionally, details on the appeal process for districts unable to meet requirements due to unexpected growth or other factors are outlined. Recommendations for alternative transfer calculations to address compliance challenges are also provided, along with accountability plans for lab schools and charter programs.

Class Size Amendment Update: Compliance and Transfer Calculations (February 2004)
E N D
Presentation Transcript
Class Size Amendment UpdateFebruary 17, 2004 • 2004 District Class Size Averages • Districts in Compliance • Transfer Calculations • Review of Appeals • Approval of Recommended Alternative Transfer Calculations
2003 Baseline___ Grades K-3 23.07 Grades 4-8 24.16 Grades 9-12 24.10 2004 District AveragesChange Grades K-3 20.54 -2.53 Grades 4-8 22.43 -1.73 Grades 9-12 24.06 -0.04 District Class Size AveragesUpdated Through 1/23/04
Districts Reducing to the Required Grade Group Cap or By 2 Students Districts in Compliance Grade GroupDecember 16, 2003 January 23, 2004 K-3 44 55 (30 at Cap) 4-8 50 62 (53 at Cap) 9-12 63 63 (62 at Cap) All Grade Groups 35 50 (28 at Cap)
DISTRICT CLASS SIZE AVERAGES DO NOT TELL THE REAL STORY • 72 PERCENT OF STUDENTS ARE IN CLASSROOMS OVER CONSTITUTIONAL CAPS
Percent of Schools and Classrooms Over Constitutional Caps Schools Classrooms Grade GroupOver CapOver Cap PK-3 67% 71% 4-8 45% 56% 9-12 25% 50% 72 PERCENT OF STUDENTS ARE IN CLASSROOMS OVER THE CONSTITUTIONAL CAPS!
Transfer Calculation • Calculate an amount from the class size reduction operating categorical which is proportionate to the amount of class size reduction not accomplished.
Example Transfer Calculation Formula: Proportion Under Target / Two Student Reduction = Proportion of Allocation Subject to Penalty X Grade Group Allocation = Dollar Amount Subject to Transfer to Capital Outlay Example: .25 / 2.00 = .125 X $1,000,000 = $125,000.
Transfer Calculation • January 6, 2004 • Transfer Calculation $41,418,199 • District Corrections Processed Through January 23rd • February 10, 2004 • Transfer Calculation $21,381,331
Appeal Process if District Does Not Meet “Requirements Despite Appropriate Effort To Do So” • District submits appeal notice and supporting documentation through January 26th • State Board of Education reviews evidence through February 17th • Commissioner recommends alternative amount to be transferred—February 17th • Legislative Budget Commission approves alternative amount to be transferred—TBA
17 School Districts and 3 Lab Schools Submitted Appeals • Clay, Collier, Escambia, Flagler, Gadsden, Glades, Hardee, Lake, Manatee, Miami-Dade, Okaloosa, Orange, Palm Beach, Polk, Putnam, Santa Rosa, Volusia, and three Lab Schools (FAMU, FAU, and FSU).
Implementation Impediments Cited Most Often • Unexpected Student Growth • Teachers Not Included in October Survey • New Hires After October • Data Processing Errors • Insufficient Space
1. Unexpected Student Growth An alternative transfer of funds is recommended for school districts experiencing student growth that was not included in the official student projections.
EXAMPLE Flagler experienced 8.73% Unexpected Growth in PK-3 Formula: Number of Students by Classroom Divided by Number of Classrooms • 15,689 Divided by 742 Equals 21.14 • 15,689 Divided by 1.0873 Equals 14,429 • 14,429 Divided by 742 Equals 19.44
Adjustment for Unexpected Student Growth • Clay11. Okaloosa • Collier12. Orange • Escambia 13. Palm Beach • Flagler 14. Polk • Gadsden15.Putnam • Glades16. Santa Rosa • Hardee17. Volusia • Lake18 FAMU Lab School • Manatee 19. FAU Lab School • Miami-Dade20.FSU Lab School
Adopt Motion for Student Growth Adjustment An alternative transfer of funds is recommended for school districts experiencing student growth that was not included in the official student projections.
Teachers Not Included in October Student Survey An alternative transfer of funds is recommended for school districts hiring teachers after the October student survey or teachers not included because of data errors.
EXAMPLE Lake hired 8 teachers after the October Survey Formula: Number of Students by Classroom Divided by Number of Classrooms • 26,600 Divided by 1,049 Equals 25.35 • 24 additional classroom periods were added • 26,600 Divided by 1,073 Equals 24.79
Adjustment for Teachers Added After October Survey • Clay11. Okaloosa • Collier12. Orange • Escambia 13. Palm Beach • Flagler14. Polk • Gadsden15.Putnam • Glades16. Santa Rosa • Hardee17. Volusia • Lake18 FAMU Lab School • Manatee19. FAU Lab School • Miami-Dade20.FSU Lab School
Adopt Motion for Additional Teacher Adjustment An alternative transfer of funds is recommended for school districts: • Hiring new teachers after the October student survey. • Adding existing teachers that were not reported in October student survey.
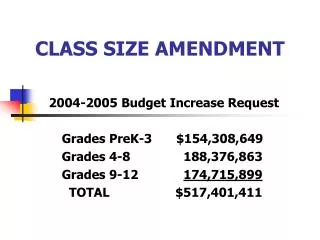
Recommended Alternative Transfer Calculation • Flagler $91,000 • Gadsden 21,452 • Hardee 90,845 • Manatee 67,858 • Miami-Dade 323,778 Transfer to Capital • Okaloosa 200,552 Outlay Funds • Palm Beach 636,324 $1,507,296 • Putnam 75,487 • FAMU Lab School 11,968 • FAU Lab School 21,037 Accountability Plans • FSU Lab School 239,234 $272,239 TOTAL $1,779,535
Recommended Accountability Plans for Lab Schools, Charter Schools, and DJJ Educational Programs • Lab School $272,239 • DJJ Educational Programs $679,293 • Charter Schools $4,848,610
Department of Juvenile Justice (DJJ) Educational Programs Section 235.1975 Cooperative development of educational facilities in juvenile justice programs. Funding: Facilities and Maintenance in DJJ budget. Educational Programs in Education budget.
Charter Schools School-level class size averages are calculated for individual charter schools. Until school-level compliance is required for all public schools, charter schools, in conjunction, with their sponsors, should develop accountability plans for the use of class size reduction funds and to measure progress toward meeting school-level compliance.
Adopt Motion to Require Accountability Plans for the Use of Class Size Reduction Funds • Lab Schools • Department of Juvenile Justice Educational Programs • Charter Schools
NEXT STEPS • February 20 • Commissioner submits budget amendment to Executive Office of the Governor and Legislature • TBA • Legislative Budget Commission meets for final approval of alternative assessments
Consequences of Continuing Non-Compliance • 2003-04 and 2004-2005 • Funds Transferred • 2005-06 • Funds Transferred • Tool Box Options Required • 2006-2007 • Funds Transferred • Tool Box Options Required • Constitutional Compliance Plan
District Profiles Percent of PK-3 Ave. 4-9 Ave. 9-12 Ave. New Hires Class Size Dollars Clay 18.94 20.34 22.58 109 100% Collier 18.11 22.10 24.49 99 69 Escambia 19.82 22.33 24.45 125 69% Flagler 21.14 24.10 23.06 35 100% Gadsden 20.04 19.62 19.04 0 0 Glades 19.49 24.64 17.71 4 100% Hardee 20.50 20.67 22.79 3 14% Lake 20.12 22.00 25.35 147 84% Manatee 20.05 21.96 25.29 134 94% Miami-Dade 27.26 27.25 25.88 778 64% Okaloosa 17.97 22.22 24.84 110 91% Orange 18.57 21.25 24.79 228 38% Palm Beach 22.23 23.44 25.08 558 98% Polk 19.06 20.62 23.08 228 77% Putnam 18.48 18.81 19.63 0 0 Santa Rosa 20.34 22.78 24.92 82 78% Volusia 20.61 20.95 23.07 124 41% STATEWIDE 20.54 22.43 24.06 6,816 72%