Download
1 / 36
510 likes | 990 Vues
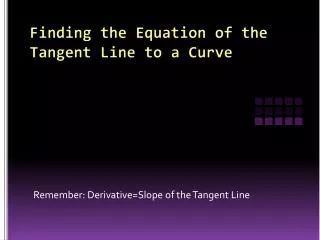
3.6 Finding the Equation of the Tangent Line to a Curve. Remember: Derivative=Slope of the Tangent Line. What is another way to find the slope of this line?. The DERIVATIVE!!!!. What is another way to find the slope of this line?.

E N D
3.6 Finding the Equation of the Tangent Line to a Curve Remember: Derivative=Slope of the Tangent Line
What is another way to find the slope of this line? The DERIVATIVE!!!!
Both ways give you the slope of the tangent to the curve at point A. set them equal to each other That means you can _____________________________.
Therefore, Is the slope of the tangent line for f(x)=x2+1
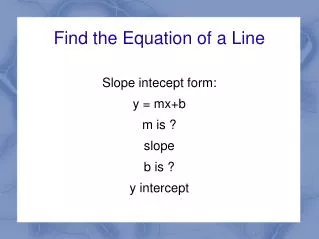
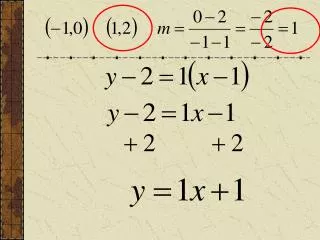
Formula of the tangent line at a point A (a, f(a)) y-f(a)=f’(a)(x-a)
Review of Steps: Using f(x)=3x2-4x at x=-3 Step 1: Find the point of contact by plugging in the x-value in f(x). This is f(a).
Review of Steps: Using f(x)=3x2-4x at x=-3 Step 2: Find f’(x). Plug in x-value for f’(a)
Review of Steps: Using f(x)=3x2-4x at x=-3 Step 3: Plug all known values into formula y-f(a)=f’(a)(x-a)
Practice: • Find the equation of the tangent to y=x3+2x at: • x=2 • x=-1 • x=-2
Question: If the tangent line to a point of f(x) was horizontal, what would that tell us about f’(x)? f’(x)=0
Example: Find the coordinates of any points on the curve with the equation f(x)=x3+3x2-9x+5 where the tangent is horizontal. Step 1: Find the derivative, f’(x)
Example: Find the coordinates of any points on the curve with the equation f(x)=x3+3x2-9x+5 where the tangent is horizontal. Step 2: Set derivative equal to zero and solve, f’(x)=0
Example: Find the coordinates of any points on the curve with the equation f(x)=x3+3x2-9x+5 where the tangent is horizontal. Step 3: Plug solutions into original formula to find y-value, (solution, y-value) is the coordinates.
Example: Find the coordinates of any points on the curve with the equation f(x)=x3+3x2-9x+5 where the tangent is horizontal. Note: If it asks for the equation then you will write y=y value found when you plugged in the solutions for f’(x)=0
Example: Find the coordinates of any horizontal tangents to y=x3-12x+2
If a question asks for the coordinates of the point on a curve where the tangent has a gradient equal to some number ‘a’, then you solve like you are finding the point where the tangent is horizontal except put the derivative equal to ‘a’ instead of 0 and solve
What do you notice about the labeled minimum and maximum? They are the coordinates where the tangent is horizontal Let’s look at the graph of the function f(x)=x3+3x2-9x+5(we have already found the coordinates where the tangent to this curve is horizontal).
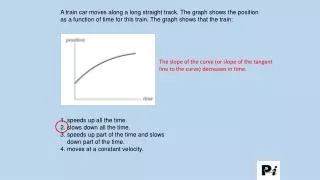
Why does that make sense? Where is the graph increasing? {x| x<-3, x>1} What is the ‘sign’ of the derivative for these intervals? + + -3 1 This is called a sign diagram
Why does that make sense? Where is the graph decreasing? {x| -3<x<1} What is the ‘sign’ of the derivative for this interval? – + + -3 1 What can we hypothesize about how the sign of the derivative relates to the graph? f’(x)=+, then graph increases f’(x)= – , then graph decreases
Why does that make sense? We can see this: When the graph is increasing then the gradient of the tangent line is positive (derivative is +) When the graph is decreasing then the gradient of the tangent line is negative (derivative is - )
Why does that make sense? So back to the question…Why does the fact that the relative max/min of a graph have horizontal tangents make sense? A relative max or min is where the graph goes from increasing to decreasing (max) or from decreasing to increasing (min). This means that your derivative needs to change signs.
Why does that make sense? Okay…So what? To go from being positive to negative, the derivative like any function must go through zero. Where the derivative is zero is where the graph changes direction, aka the relative max/min
BEWARE: The coordinates where f’(x)=0 is not always a relative maximum or minimum Take a look at f(x)=x3. What is the coordinates of the point on the function where the derivative is equal to 0? Find the graph in your calculator, is this coordinate a relative maximum or a relative minimum? NO – the graph only flattened out then continued in the same direction This is called a HORIZONTAL INFLECTION
BEWARE: The coordinates where f’(x)=0 is not always a relative maximum or minimum It is necessary to make a sign diagram to determine whether the coordinate where f’(x)=0 is a relative maximum, minimum, or a horizontal inflection.
Vocabulary: Anywhere that f’(x)=0 is called a stationary point; a stationary point could be a relative minimum, a relative maximum, or a horizontal inflection
Think, Pair, Share: • What do you know about the graph of f(x) when f’(x) is a) Positive b) Negative c) Zero • What do you know about the slope of the tangent line at a relative extrema? Why is this so? • Sketch a graph of f(x) when the sign diagram of f’(x) looks like • What are the types of stationary points? What do they all have in common? What do the sign diagrams for each type look like? – + – ? ? 1 -5 Stationary Point
Practice: Using the derivative determine where the function is increasing/decreasing. Give the coordinates of all relative maxima and minima.
Vocabulary • Critical Points – points on a graph in which a line drawn tangent to the curve is horizontal or vertical • Maximum • Minimum • Point of Inflection
Maximum • When the graph of a function is increasing to the left of x = c and decreasing to the right of x = c.
Minimum • When the graph of a function is decreasing to the left of x = c and increasing to the right of x = c
Point of Inflection • Not a maximum or minimum • “Leveling-off Point” • When a tangent line is drawn here, it is vertical