Download
1 / 235
2.35k likes | 2.49k Vues
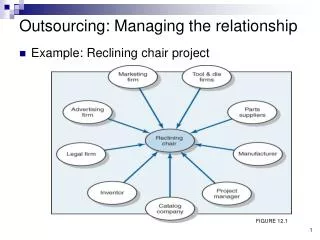
In this comprehensive guide, Michael Scofield, a leading expert in data management, explores the intricacies of managing data acquisition and exchange relationships. Covering key topics from data quality assessment to the implications of data architecture, the content emphasizes understanding data needs, expectations of stakeholders, and legal considerations. With insights gathered from decades of experience in both academia and industry, this guide aims to enhance your organization's ability to acquire, manage, and leverage external data effectively.

E N D
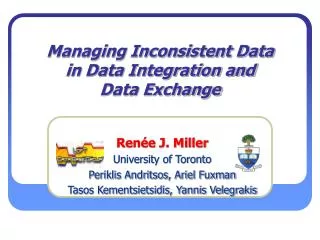
Managing the Data Acquisition & Exchange Relationship By Michael Scofield Manager, Data Asset DevelopmentESRI, Inc. Redlands, CA Asst. Professor, Health Information ManagementLoma Linda University NMScofield@aol.com Vers. 32 MSP June 9, 2008 L-3
About Michael Scofield • Michael Scofield is Manager of Data Asset Development at ESRI in Redlands, California. He is a popular speaker in topics of data management, data quality, data warehouse design, as well as satellite imagery interpretation and emergency communications. His career has included education and private industry in areas of data warehousing and data management. His articles appear in DM Review, the B-Eye Newsletter, InformationWeek magazine, the IBI Systems Journal, and other professional journals. • He has spoken to over 120 professional audiences for groups such as Data Management Assn chapters, European Metadata Conferences, Information Quality Conferences, The Data Warehousing Institute, Oracle User Groups, Institute of Internal Auditors, Assn. of Government Accountants, Quality Assurance Association chapters, Assn. for Computing Machinery and other professional and civic audiences. • Mr. Scofield is also Asst. Professor of Health Information Management at Loma Linda University. NMS intro
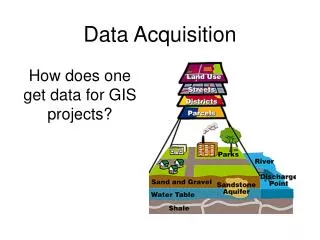
Alternate titles: • “Managing the Data Acquisition Relationship” • “How Not to Mess Up When You Import Data” “data acquisition” …traditionally in science and engineering instrumentation. “data” Source User
Topics & Areas of Concern • Spelling out the relationship • Difference between data and information • Understanding specific data and information needs • Asking for the right data and finding what you need • Data value and utility • Assessing the burden on potential data providers • Scope and complete-ness of data
Topics(cont.) • Versioning and timeliness • Media and physical format • Compatibility of logical data architectures • Data quality assessment • Updates and refresh issues • Data collection bias • Legal issues • Continuing data flow surveillance
How do you describe a dataset? • ArchitectureWhat subjects (things) are described by a record Facts/fields/attributes/columns Logical data model • ScopeWhat records are included excluded on dimensions Dimensions: time, geography, org., • CurrencyCompared to declared scope Table level, and column-specific • QualityPrecision Complete-ness (by column) Accuracy However….data acquisition is much, much more.
Introduction • Why talk about this? • Because… • …we want more and more data, and we don’t generate it all ourselves. • So….we acquire it somewhere else.
Never a simple flow of data! Relationship User(“target”) “data” Source Expectations: subjects covered by data scope of data quality of data currency of data Expectations: money how you use data burden others? Terms: Usage rights Often forgotten topics: Updates and refresh Corrections Documentation Other measures of quality
Kinds of data “flows” Trigger events: Elapsed time (day, week, month, sub-day) Source business event(usually a transaction) Target business event(transaction makes request for limited data; e.g. bal. chk.) Human decision (e.g. BI) Record growth trigger(e.g. every 5,000 records in a source transaction file) “Push” vs. “pull”: When the trigger happens, which side does the heavy work? Push: Data host compiles data file and sends a data file. target environment App. Pull: Data requestor sends query to source database. query target environment Appl. database Importapp. results
Flows exist in many places Data supplier Enterprise Appl. A Appl. B Un-coordinated applications DW Outsidedatauser Acquired division Business Intelligence Appl. G
Each source has a data architecture Data supplier Enterprise Constraints Appl. A Appl. B Expectations Un-coordinated applications DW Outsidedatauser Acquired division Business Intelligence Appl. G
What is data architecture? • The logical and semantic structure of the business (or that part of the business) and the data which describes and supports it. • Described by a data model • Subject entities Relationships Attributes Entity-relationship diagram • Is abstract (not understood by many) • Can be complex
Each FLOW has a data architecture Data supplier Enterprise Appl. A Appl. B Expectations Un-coordinated applications DW Outsidedatauser Acquired division Appl. G B.I.
Enterprise-captured data life cycle Transaction-based data capture Data derivation & enhancement Executivesummaryreports Businessapplication Association with own history Integration with other lateral data Computing derived data (ratios, aggregates, etc.) other in-house applications Businessdatabase other in-house applications export DW Archive
Reasons to import data • Enhance an internal DW for support of improved executive decision-making. • Bolster operational data resources independent of the data exchange relationship. • Engage in new business processes involving a B2B partnership formed through data exchange. • E-discovery: litigation DW B.I.
Reasons to import data Timing: DW B.I. Periodic big batch files: daily, weekly, monthly, etc. Transaction-driven: “micro” data flows (SOA) One-time
Introduction Spelling out the Relationship Data & information Universe of knowledge Asking for the right data Potential data providers Physical forms and media Logical data architecture Semantics & meaning Documentation & metadata Scope & completeness Fund. of data quality Update & refresh issues Data collection bias Ownership & legal Confidentiality Data flow surveillance Conclusion Spelling out the relationship
Key questions: • What are your expectations? • What are your uses of the data? • What motivates the source to give it to you? • What are the political-cultural barriers between you and the source? • What are your expectations of… • quality, complete-ness, currency media updates and refresh • How can you strengthen the relationship?
Political & cultural barriers Separate system them you Peer division or department them you Totally unrelated legal entity you them “Information is power!”People don’t want to give up power.
Typical risks and surprises • To save money, the source does not maintain previous quality in data capture and processing. Updates show lower quality. • To expand its market, the source alters the logical and physical data architecture without telling you. • In response to business morphing pressures, the source alters the coding scheme for one or more fields. • The source discovers some errors, but does not inform you of it, nor supply you with corrections or corrected records.
Mitigating strategies • Spell out all expectations about the data. • Develop language, words, & models to enhance precision of communication about data expectations. • Rigorous testing of data prior to purchase • Strengthen relationship through cooperative data testing strategies Offer to test their updates Provide non-threatening feedback on DQ Get source to seek you out as consultant on DQ (this will allow you to monitor their morphing pressures)
Introduction Spelling out the Relationship Data & information Universe of knowledge Asking for the right data Potential data providers Physical forms and media Logical data architecture Semantics & meaning Documentation & metadata Scope & completeness Fund. of data quality Update & refresh issues Data collection bias Ownership & legal Confidentiality Data flow surveillance Conclusion Data & information structured data and unstructured data What makes data (information) useful?
Data vs. information data information simple (single) observation, fact, or declaration data (facts) with context to be more meaningful and useful “Knowledge: valuable information from the human mind” For many thinkers, there is a subtle, almost philosophical difference between data and information.
Initial definitions • Things and events. • A single observation about reality, clearly defined. • One or more items of data, with definition and context to make it meaningful. • Simultaneous awareness of much information, and ability to cognitively integrate it. • Knowing not to sleep through this lecture. • Reality • Data • Information • Knowledge • Wisdom
Structural elements of tabular “data” Database Piece of data; “a fact”a.k.a. “cell” 2 Record Table What are you seeking? A fact, a record, a table, or a database?
Acquiring data or information? Tabular Semi-structured Unstructured Text document Cartesian dataset Web page diary, memoirs The web is not a source! It is a medium! multi-table database Raster
Data vs. meaning Are these the same data? Source A Source B Same meaning? Yes. But not the same data. Mixed case is difficult to derive correctly from ALL CAPS.
Introduction Spelling out the Relationship Data & information Universe of knowledge Asking for the right data Potential data providers Physical forms and media Logical data architecture Semantics & meaning Documentation & metadata Scope & completeness Fund. of data quality Update & refresh issues Data collection bias Ownership & legal Confidentiality Data flow surveillance Conclusion Universe of knowledge, information, & data
Structured vs. unstructured data Structured data Unstructured data Personal letters Memoirs, diaries Literature (history, poetry, fiction) Most books Still images (paintings, photos, x-ray, ultrasound) Sounds (sound recordings, EKG, SOSUS) Moving images(cinema, TV, etc.) Most tabular databases: businessgovernmentscience & research Can fit into RDBMS
Structured vs. unstructured data Structured data Unstructured data Geospatial data Vector data streets, areas “points, lines, polygons” Raster imagery topos GIS data
Parsing and processing data Tabular data Unstructured data tabular unstructured Computers are good at processing. SQL, relational model, etc. Humans are good at processing. memory, free association.
Processing unstructured data Examples: Hearing classical music, and correctly guessing the composer. Recognizing the signature style of a oil painting. Recognizing voices Reading emotions on faces Understanding incomplete sentences. Seeing humor (intended and not). . Unstructured data Humans are good at processing. memory, free association.
Asking for the right data Introduction Spelling out the Relationship Data & information Universe of knowledge Asking for the right data Potential data providers Physical forms and media Logical data architecture Semantics & meaning Documentation & metadata Scope & completeness Fund. of data quality Update & refresh issues Data collection bias Ownership & legal Confidentiality Data flow surveillance Conclusion …or… Asking for the right information
Who is the first user? …the final user? • Analytical support of macro-decisions • Data warehouse and business intelligence Probably to be manipulated by analysts High-level decision-maker will use final output • Operational business system(micro-decisions) • geocoding customers CRM Oil exploration Agricultural field characteristics • Pure, undirected research • Discovery for litigation
“Yeah, we got data. Lots of data!” • 010011010111001001111011101100100010110111000101101100011001000000000001111000000111001110000000011101101110110001000010000010111001001111011101100100010110111000101100101100101110010011110111011001000110010000000000011110000001110011100000000111011011101100101101110011001011011000110010011100111000000001110000000001101110110001000010100100100110011000000000000000110001101011001100100111001110000000011101101110110001000010000010011001111010011010101011100100111101110110010001011011100010110110001100100000000000111100000011100111000000001110110111011000100001000001011100100111101110110010001011011100010110010110010111001001111011101100100011001000000000001111000000111001110000000011101101110110010110111001100101101100011001001110011100000000111000000000110111011000100001010010010011001100000000000011001001110011100000000100110011110100100110010011100111000000001110110111011000100001000001001100111101001000001100011010110011001001110011010011001111000110101101011100100111101110000010010001001110010101010001000010010001001001001000100000110010001011011100010110110001111100110011100111000000001110110111011000100001000001001100111100011010100000010111000011101101110110001000010000010011001111010010011001001110011100000000111011011101100010000100
Always strive to make information more useful to the recipient! Basketball scores Los Angeles LXXIV San Antonio LXVII Detroit LXXXV Boston LXXIII Seattle LXXV Phoenix LXXIX
Data vs. expression % sales to sales division minorities----------------------------NORTHEAST 12.3SOUTHEAST 39.1MIDWEST 21.3SOUTHWEST 17.6PACIFIC 14.9 -----------------------------TOTAL U.S. 20.8 Executive may ask for this: Are you going to ask for just six records from your source? This information (report) has a high probability of being inadequate. The executive will inevitably ask for more. No! Why?
Supporting macro-decisions is iterative. % sales to sales division minorities----------------------------NORTHEAST 12.3SOUTHEAST 39.1MIDWEST 21.3SOUTHWEST 17.6PACIFIC 14.9 -----------------------------TOTAL U.S. 20.8 Knowledge worker(s) External sources ProcessFilteringAggregationExplorationCorrelationAnalysis B.I. Internal sources Data whse Data mart(s) ETL
Raw data vs. derived data • You always want raw data, at the most granular level possible ! • No ratios or averages --they can NOT be aggregated. Population Density = Avg = 219.2 derived data raw data
Anticipate the analysis and information delivery. • Have data analysis tools ready. • Output will be iterative. • Best output allows for graphic analysis • Time series are valuable… • …but require history. • Don’t neglect history when asking for data.
Why trend graphs (a.k.a. “time series”)? Deaths per 100,000 persons due to heart disease in CY-2000 257 This statistic alone, lacks meaning! We must give it context!
How do executives make decisions? • Cognitive vs. feelings When executives ask for data or information, be sure they understand the total costs.
Tables (raw data) are hard to understand U.S. Monthly unemployment statistics
Unemployment Clinton Bush II Source: Bureau of Labor Statistics web site
Placing data points into context yields information! Surround your requested data points with context! Time series Peer data Causal factors Breakdown / drilldown Graphical expression All these require many more data points than the executive originally requested! On nearly every dimension.
Choices in detail of data • Original or derivative • Granular or summary • Filtered or not • Translated or not Data is always easier to aggregate than to disaggregate! It is always easier to filter out unneeded data than to request more data later.
Converting data to information • Query and reporting tool are required • Needed functions: • Aggregation • Sorting and filtering • Association and joining • Clustering and stratification • Graphics
Converting data to information Add context Raw data 50,000 200 deaths from TBin Baker County,CY-2004 Avg. populationBaker County,CY-2004 Add context 4 deaths per 1,000 pop.Baker Co., CY-2004 Compute ratio Conclusion: Baker County has the lowest TB rate of 5 peer counties.
Converting data to information Raw data Add context Compute ratio Add context Useful information