
A Quick Introduction to Approximate Query Processing
E N D
Presentation Transcript
A Quick Introduction to Approximate Query Processing CS286, Spring’2007 Minos Garofalakis
Outline • Intro & Approximate Query Answering Overview • Synopses, System architectures, Commercial offerings • One-Dimensional Synopses • Histograms, Samples, Wavelets • Multi-Dimensional Synopses and Joins • Multi-D Histograms, Join synopses, Wavelets • Set-Valued Queries • Using Histograms, Samples, Wavelets • Discussion & Comparisons • Advanced Techniques & Future Directions • Dependency-based, Workload-tuned, Streaming data
Decision Support Systems • Data Warehousing: Consolidate data from many sources in one large repository. • Loading, periodic synchronization of replicas. • Semantic integration. • OLAP: • Complex SQL queries and views. • Queries based on spreadsheet-style operations and “multidimensional” view of data. • Interactive and “online” queries. • Data Mining: • Exploratory search for interesting trends and anomalies. (Another lecture!)
Introduction & Motivation • Exact answers NOT always required • DSS applications usually exploratory: early feedback to help identify “interesting” regions • Aggregate queries: precision to “last decimal” not needed • e.g., “What percentage of the US sales are in NJ?” (display as bar graph) • Preview answers while waiting. Trial queries • Base data can be remote or unavailable: approximate processing using locally-cached data synopses is the only option DecisionSupport Systems(DSS) SQL Query Exact Answer Long Response Times!
Fast Approximate Answers • Primarily for Aggregate Queries • Goal is to quickly report the leading digits of answers • In seconds instead of minutes or hours • Most useful if can provide error guarantees E.g., Average salary $59,000 +/- $500 (with 95% confidence) in 10 seconds vs. $59,152.25 in 10 minutes • Achieved by answering the query based on samples or other synopses of the data • Speed-up obtained because synopses are orders of magnitude smaller than the original data
Approximate Query Answering Basic Approach 1: Online Query Processing • e.g., Control Project [HHW97, HH99, HAR00] • Sampling at query time • Answers continually improve, under user control
Approximate Query Answering Basic Approach 2: Precomputed Synopses • Construct & store synopses prior to query time • At query time, use synopses to answer the query • Like estimation in query optimizers, but • reported to the user (need higher accuracy) • more general queries • Need to maintain synopses up-to-date • Most work in the area based on the precomputed approach • e.g., Sample Views [OR92, Olk93], Aqua Project [GMP97a, AGP99,etc]
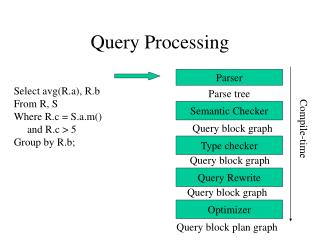
The Aqua Architecture SQL Query Q Data Warehouse (e.g., Oracle) Q Network Result HTML XML Browser Excel Warehouse Data Updates • Picture without Aqua: • User poses a query Q • Data Warehouse executes Q and returns result • Warehouse is periodically updated with new data
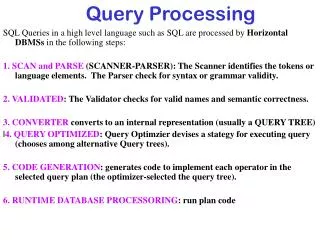
The Aqua Architecture Rewriter [GMP97a, AGP99] Picture with Aqua: • Aqua is middleware, between the user and the warehouse • Aqua Synopses are stored in the warehouse • Aqua intercepts the user query and rewrites it to be a query Q’ on the synopses. Data warehouse returns approximate answer SQL Query Q Data Warehouse (e.g., Oracle) Q’ Network Result (w/ error bounds) HTML XML Browser Excel AQUA Synopses Warehouse Data Updates AQUA Tracker
Online vs. Precomputed Online: + Continuous refinement of answers (online aggregation) + User control: what to refine, when to stop + Seeing the query is very helpful for fast approximate results + No maintenance overheads +See [HH01] Online Query Processing tutorial for details Precomputed: + Seeing entire data is very helpful (provably & in practice) (But must construct synopses for a family of queries) + Often faster: better access patterns, small synopses can reside in memory or cache +Middleware: Can use with any DBMS, no special index striding + Also effective for remote or streaming data
Commercial DBMS • Oracle, IBM Informix: Sampling operator (online) • IBM DB2: “IBM Almaden is working on a prototype version of DB2 that supports sampling. The user specifies a priori the amount of sampling to be done.” • Microsoft SQL Server: “New auto statistics extract statistics [e.g., histograms] using fast sampling, enabling the Query Optimizer to use the latest information.” The index tuning wizard uses sampling to build statistics. • see [CN97, CMN98, CN98] In summary, not much announced yet
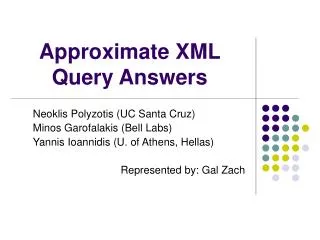
Approximate Query Processing using Data Synopses Compact Data Synopses “Transformed” Query Approximate Answer KB/MB FAST!! • How to construct effective data synopses ?? DecisionSupport Systems(DSS) SQL Query Exact Answer Long Response Times! GB/TB
Outline • Intro & Approximate Query Answering Overview • One-Dimensional Synopses • Histograms: Equi-depth, Compressed, V-optimal, Incremental maintenance, Self-tuning • Samples: Basics, Sampling from DBs, Reservoir Sampling • Wavelets: 1-D Haar-wavelet histogram construction & maintenance • Multi-Dimensional Synopses and Joins • Set-Valued Queries • Discussion & Comparisons • Advanced Techniques & Future Directions
Relations as Frequency Distributions sales salary name age One-dimensional distribution tuple counts Age (attribute domain values) Three-dimensional distribution tuple counts 8 10 10 age 30 20 50 sales 25 8 15 salary
Histograms • Partition attribute value(s) domain into a set of buckets • Issues: • How to partition • What to store for each bucket • How to estimate an answer using the histogram • Long history of use for selectivity estimation within a query optimizer [Koo80], [PSC84], etc. • [PIH96] [Poo97] introduced a taxonomy, algorithms, etc.
1-D Histograms: Equi-Depth 1 2 2 3 4 7 8 9 1010 10 10 11 11 12 12 14 16 16 18 19 20 20 20 • Goal: Equal number of rows per bucket(B buckets in all) • Can construct by first sorting then taking B-1 equally-spaced splits • Faster construction: Sample & take equally-spaced splits in sample • Nearly equal buckets • Can also use one-pass quantile algorithms (e.g., [GK01]) Count in bucket 1 2 3 4 5 6 7 8 9 10 11 12 13 14 15 16 17 18 19 20 Domain values
1-D Histograms: Equi-Depth Split 4 5 6 7 8 9 4 5 6 7 8 9 • Can maintain using one-pass algorithms (insertions only), or • Use a backing sample [GMP97b]: Maintain a larger sample on disk in support of histogram maintenance • Keep histogram bucket counts up-to-date by incrementing on row insertion, decrementing on row deletion • Merge adjacent buckets with small counts • Split any bucket with a large count, using the sample to select a split value, i.e, take median of the sample points in bucket range • Keeps counts within a factor of 2; for more equal buckets, can recompute from the sample Count in bucket 1 2 3 4 5 6 7 8 9 10 11 12 13 14 15 16 17 18 19 20 Domain values
1-D Histograms: Compressed • Create singleton buckets for largest values, equi-depth over the rest • Improvement over equi-depth since get exact info on largest values, e.g., join estimation in DB2 compares largest values in the relations Construction: Sorting + O(B log B) + one pass; can use sample Maintenance: Split & Merge approach as with equi-depth, but must also decide when to create and remove singleton buckets [GMP97b] [PIH96] 1 2 3 4 5 6 7 8 9 10 11 12 13 14 15 16 17 1819 20
1-D Histograms: V-Optimal [IP95] defined V-optimal & showed it minimizes the average selectivity estimation error for equality-joins & selections • Idea: Select buckets to minimize frequency variance within buckets • [JKM98] gave an O(B*N^2) time dynamic programming algorithm • F[k]= freq. of valuek; AVGF[i:j]= avg freq for valuesi..j • SSE[i:j] = sum{k=i..j}F[k]^2 – (j-i+1)*AVGF[i:j]^2 • Fori=1..N, computeP[i] = sum{k=1..i} F[k]&Q[i] = sum{k=1..i} F[k]^2 • Then can compute anySSE[i:j]in constant time • LetSSEP(i,k)= min SSE forF[1]..F[i]usingkbuckets • ThenSSEP(i,k) = min{j=1..i-1} (SSEP(j,k-1) + SSE[j+1:i]), i.e., suffices to consider all possible left boundaries for kth bucket • Also gave faster approximation algorithms
Answering Queries: Histograms Need number of distinct in each bucket 1 2 3 4 5 6 7 8 9 10 11 12 13 14 15 16 17 18 19 20 1 2 3 4 5 6 7 8 9 10 11 12 13 14 15 16 17 18 19 20 3 2 1 2 3 1 • Answering queries from 1-D histograms (in general): • (Implicitly) map the histogram back to an approximate relation, & apply the query to the approximate relation • Continuous value mapping [SAC79]: Count spread evenly among bucket values - Uniform spread mapping [PIH96]:
Self-Tuning 1-D Histograms 30 30 30 30 25 25 16 16 12 12 12 12 12 12 10 10 10 10 10 10 1 10 1 10 11 20 11 20 21 30 21 30 31 60 31 60 61 64 61 64 65 69 65 69 70 70 70 70 71 79 71 79 80 89 80 89 90 99 90 99 20 15 15 1. Tune Bucket Frequencies: • Compare actual selectivity to histogram estimate • Use to adjust bucket frequencies [AC99] query range Actual = 60 Estimate = 40 Error = +20 - Divide d*Error proportionately, d=dampening factor d=½ of Error = +10 So divide +4,+3,+3
Self-Tuning 1-D Histograms 69 split in 3 merge merge split 30 25 17 13 13 13 10 10 10 1 10 11 20 21 30 31 60 61 64 65 69 70 70 71 79 80 89 90 99 36 25 23 23 23 23 17 15 15 10 1 20 21 30 31 69 70 70 71 73 74 76 77 79 80 89 90 94 95 99 2. Restructure: • Merge buckets of near-equal frequencies • Split large frequency buckets Also Extends to Multi-D
Sampling: Basics • Idea: A small random sample S of the data often well-represents all the data • For a fast approx answer, apply the query to S & “scale” the result • E.g., R.a is {0,1}, S is a 20% sample select count(*) from R where R.a = 0 select 5 * count(*) from S where S.a = 0 R.a 1 1 0 1 1 1 1 1 0 0 0 0 1 1 1 1 1 0 1 1 1 0 1 0 1 1 0 1 1 0 Red = in S Est. count = 5*2 = 10, Exact count = 10 • Unbiased: For expressions involving count, sum, avg: the estimator • is unbiased, i.e., the expected value of the answer is the actual answer, • even for (most) queries with predicates! • Leverage extensive literature on confidence intervals for sampling • Actual answer is within the interval [a,b] with a given probability • E.g., 54,000 ± 600 with prob 90%
Sampling: Confidence Intervals Method 90% Confidence Interval (±) Guarantees? Central Limit Theorem 1.65 * (S) / sqrt(|S|) as |S| Hoeffding 1.22 * (MAX-MIN) / sqrt(|S|) always Chebychev (known (R)) 3.16 * (R) / sqrt(|S|) always Chebychev (est. (R)) 3.16 * (S) / sqrt(|S|) as (S) (R) • If predicates, S above is subset of sample that satisfies the predicate • Quality of the estimate depends only on thevariance in R & |S| after the predicate: So 10K sample may suffice for 10B row relation! • Advantage of larger samples: can handle more selective predicates Confidence intervals for Average: select avg(R.A) from R (Can replace R.A with any arithmetic expression on the attributes in R) (R) = standard deviation of the values of R.A; (S) = s.d. for S.A
Sampling from Databases • Sampling disk-resident data is slow • Row-level sampling has high I/O cost: • must bring in entire disk block to get the row • Block-level sampling: rows may be highly correlated • Random access pattern, possibly via an index • Need acceptance/rejection sampling to account for the variable number of rows in a page, children in an index node, etc • Alternatives • Random physical clustering: destroys “natural” clustering • Precomputed samples: must incrementally maintain (at specified size) • Fast to use: packed in disk blocks, can sequentially scan, can store as relation and leverage full DBMS query support, can store in main memory
One-Pass Uniform Sampling • Best choice for incremental maintenance • Low overheads, no random data access • Reservoir Sampling [Vit85]: Maintains a sample S of a fixed-size M • Add each new item to S with probability M/N, where N is the current number of data items • If add an item, evict a random item from S • Instead of flipping a coin for each item, determine the number of items to skip before the next to be added to S • To handle deletions, permit |S| to drop to L < M, e.g., L = M/2 • remove from S if deleted item is in S, else ignore • If |S| = M/2, get a new S using another pass (happens only if delete roughly half the items & cost is fully amortized) [GMP97b]