Accuracy vs. Precision in Scientific Method: A Detailed Review
410 likes | 515 Vues
Dive into the essential concepts of accuracy and precision in scientific methods, including the significance of repetition, observations, hypotheses, experiments, and data analysis. Explore the role of control variables, measurements, graphs, and more.

Accuracy vs. Precision in Scientific Method: A Detailed Review
E N D
Presentation Transcript
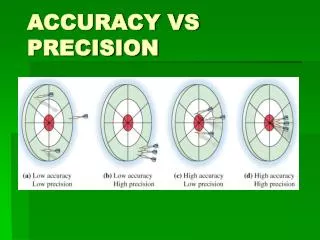
A. Review • What does the pattern of averages represent in slide two? • Pattern of averages = many repetitions • What is the purpose of repetition in science? • To over come human error or randomness • Eg. Large sample populations, same experiment many times over with the same results. • Will repetition eliminate systematic errors? • NO! A scientist has to allow for margin of error or adjust, like aiming higher to compensate or mechanically adjust the scope.
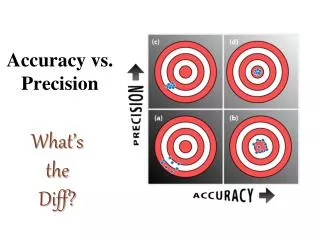
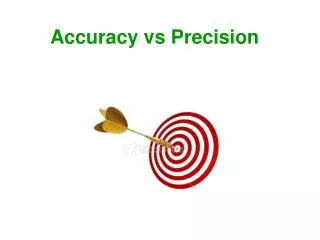
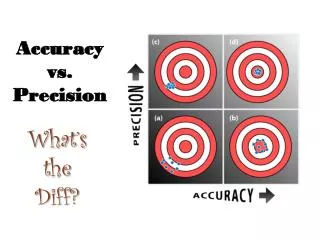
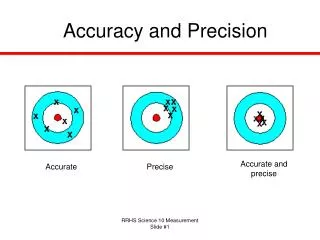
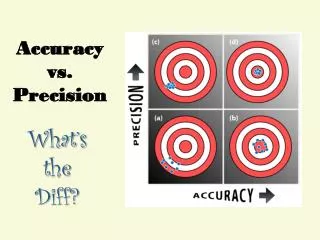
4. Target Analogy to Sci. Method • Target is the expected outcome • The holes represent actual outcome • Precision and accuracy represent analysis of results • In science we analyze expected vs. actual outcomes and come to conclusions
B. Review of Scientific Method • Observations and Research • Inferences • Hypothesis • Experiment • Variables • Results • Conclusion and Discussion
7. Part 1- Observations/Research • What are we interested in???? Come on think! • RHS example-jet propulsion • Make observations and research the topic • **Observations are measurable**
Research can come from a few areas or many. You cannot make an educated guess with out knowing something about the topic. • You can get information through: • Reading assignments in the text book. • Using the internet. • Remembering personal experience. • Notes form lectures. • Books from library or personal.
2. Inferences • Not measurable • What is an inference????? • a logical interpretation of an observation based on facts • I have my license now, therefore, I am eligible to drive
3. Implications Now that I have my license I will drive everyday to school like my brother. You may or may not drive to school everyday like your brother. You may not drive at all! Implications are possible outcomes, but not necessarily actual results. These are assumptions or possibilities. Good luck with that!
e. Deductive/Inductive reasoning • Adham: I've noticed previously that every time I kick a ball up, it comes back down, so I guess this next time when I kick it up, it will come back down, too. • Rizik: That's Newton's Law. Everything that goes up must come down. And so, if you kick the ball up, it must come down.
Adham is using inductive reasoning, arguing from observation, • Inductive = Today’s science = going from individual facts to large theories. while Rizik is using • deductive reasoning, arguing from the law of gravity. • Deductive= Early science (philosophy) = Start with the general idea and reduce it to its smaller facts.
3. HYPOTHESIS • We call this the educated “guess” based on academic research. • How would you explain this???? • Okay…it’s an “educated” (from facts) guess that will be answered (hopefully) with…
AKA. Materials and Methods • Otherwise known as the test procedure • Why is it important to be accurate and precise??? Why is it important to be clear and concise? • So it can be repeated…like excuses for being tardy to class. You and your friends stay late for lunch resulting in lateness, thus you devise an excuse and see if that works… • because we all know you’ll try it again if it does work, it not move something else…
You must document everything done in an experiment so others can reproduce the experiment to confirm (or disprove) your results. • Measurements must be recorded and exact!
a. What are variables????? • Manipulated/Independent Variable: • What you change MV (IV) • Responding/Dependant variable: • What responds to the RV (DV) • Control (s) the unchanged variable to compare to the Manipulated C • Identifying variables assignment (front)
What variable was your control, what was your dependent variable, your independent variable? • This makes graphing easier; • your independent variable is on the X-axis and • your dependent variable is on the Y-axis. • Graphs are analytical tools to aide in interpreting your data. (Note: graphs are used only in quantitative data.)
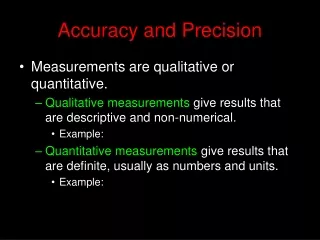
5 – Analysis/Results (Quantitative and Qualitative) • What does the data from your results tell you? • Hard numbers are stated here. No discussion or interpretation of results is given. Graphs and data tables are referenced so reader can see mathematical results visually. Percent margin of error is also part of results both systematic and random. (Quantitative) • When subject A consumed 2000 grams of black licorice containing caffeine, systolic and diastolic blood pressure increased by 10 points, 3000 grams and so on. You describe what actually happened. (Qualitative) What would your control and variables be in this experiment????
Time to play!!!!! • Graph your height experiment Lab • Measure Up Lab
In the graph your height experiment identify controls and variables • C- same meter stick for all students • MV-inches (X axis) • RV-centimeters (Y axis) • Results expected outcome = 2.54 cm per in and actual was______ with a margin of error. • What type of error did we have? • random because sticks were off slightly (human) • How did we adjust for error? Many samples
6-Conclusion – • Was your hypothesis right or wrong? You accept or reject your hypothesis and discuss • A discussion of what you discovered by doing this experiment. Any formulas you proved, or derived by doing this experiment should be discussed. Did you accomplish your purpose? In other words – What did you learn. What tool was most significant in explaining your findings? (Inferences) • If your hypothesis was wrong you should think things over or trouble-shoot, write a new hypothesis, and retest. (implications)
C. Significant Digits and Scientific Notation • Sig. Fig. rules • Digits from 1-9 are always significant (non zero). • Zeros between two other significant digits are always significant • Final zeros to the right of the decimal point are significant digits. • Zeros used solely for spacing the decimal point (placeholders) are not significant.
1.) Determine the least-significant place of each term in the addition. • The least-significant place of 6.101 is the thousandths place. • The least-significant place of 7.4 is the tenths place.
2.) The result of addition should be rounded to the same least- significant place as the term with the largest least-significant place. • The result should be rounded to the tenths place.
3) Round the result to the proper least-significant place. • The arithmetic result of 13.501 rounded to the tenths place is 13.5.
Examples • 2804 • 4 sig. fig • 2.84 • 3 sig. fig • 0.0029 • 2 sig. fig • .003068 • 4 sig. fig • .100 • 3 sig. fig. because final zero is trailing and therefore sig.
34, 780, 0.507,1.200, and 2 • Add these together and what is the final answer using the rules of sig. figs.? • Did you get the number 817.707? • What is your final answer? • You can only have an answer that is as precise as the number containing the least amount of sig. figs. • 800
Scientific Notation • Rule for Addition and Subtraction - when adding or subtracting in scientific notation, you must express the numbers in the same power of 10. This will often involve changing the decimal place of the coefficient. (use lowest number of exponent) • Rule for Multiplication - When you multiply numbers with scientific notation, multiply the coefficients together and add the exponents. The base will remain 10. • Rule for Division - When dividing with scientific notation, divide the coefficients and subtract the exponents. The base will remain 10. • Complete worksheets
Examples • Express in Scientific Notation • 5800 • 5.8 x 10³ • 450,000 • 4.5 x 10⁵ • 302,000,000 • 3.02 x 10⁸ • 86,000,000,000 • 8.6 x10¹⁰
Examples • 6.0 x 10⁻³ mg + 2 x 10⁻⁴ mg • Change 2 to .2 to make 10-3 • Exponents now the same so add • Make exponents the same • 6.0 + .2 = 6.2 x 10⁻³ • 6 x 10⁻⁸ – 4 x 10⁻⁸ • 2 x 10⁻⁸
Examples • (2 x 10⁴m) (4 x 10⁸m) • 2 x 4 =8 x 10¹² m2 • Add the exponents • 6 x 10⁸ kg/2 x 104 m3 • 6/2 = 3 x 10⁴ kg/m3 • Subtract exponents
Direct Relationship y=mx+b Direct Relationship
In physics we measure: • Distance in meters (m) • Mass in kilograms (Kg) • Time in seconds (s)
Assignments • Chapter 2 practice problems 1-3,6-8b,9a-9c,12a-12b,13-17b (starts on page 20) • Chapter 2 review problems 30-43 and 46-47 (starts on page 39) • Chapter 2 study guide handout