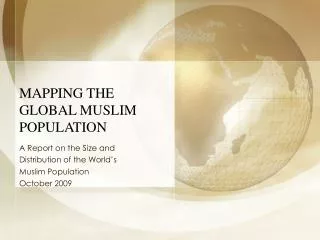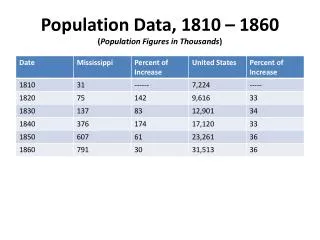
Advanced Techniques for Population Data Mapping
Explore innovative mapmaking methods to visualize population data effectively beyond basic choropleth maps. Learn about proportional symbols, dot density, dasymetric mapping, and more to create informative and engaging maps.

Advanced Techniques for Population Data Mapping
E N D
Presentation Transcript
Mapping Population Data Kenneth Field
Unique Values Mapmaking Beyond the Basics
Choropleth: single hue Mapmaking Beyond the Basics
Choropleth: diverging hue Mapmaking Beyond the Basics
Unclassed choropleth Mapmaking Beyond the Basics
Value by Alpha Mapmaking Beyond the Basics
Graduated Symbol Mapmaking Beyond the Basics
Proportional Symbol Mapmaking Beyond the Basics
Dot Density Mapmaking Beyond the Basics
Dasymetric Mapmaking Beyond the Basics
Isopleth Mapmaking Beyond the Basics
Filled contours Mapmaking Beyond the Basics
Proportional text Mapping Population Data
Equal-area Cartogram Mapmaking Beyond the Basics
Non contiguous cartogram Mapmaking Beyond the Basics
Prism Mapmaking Beyond the Basics
Thematic Mapping Arcgis.com – search ‘thematic mapping’ Mapping Population Data
@kennethfield kfield@esri.com Mapping Population Data
Thank you… Please fill out the session survey: First Offering ID: 1276 Second Offering ID: Online – www.esri.com/ucsessionsurveys Paper – pick up and put in drop box Mapping Population Data