Data Frequency Distribution and Histograms: Analyzing Population Samples
Learn how to create frequency distributions and histograms for given data sets. Understand concepts such as population, sample, data points, and relative frequencies. Practice organizing data into intervals to construct insightful histograms.

Data Frequency Distribution and Histograms: Analyzing Population Samples
E N D
Presentation Transcript
Objectives • Create a frequency distribution for a given set of data. • Construct a histogram from a frequency distribution.
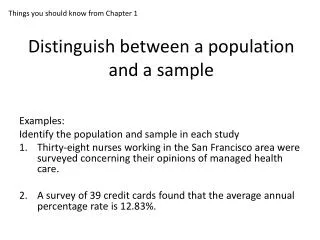
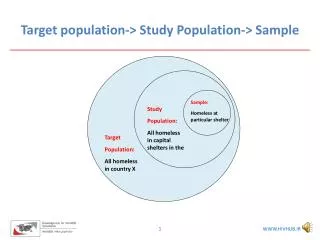
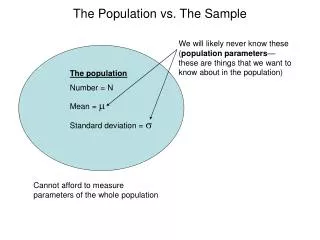
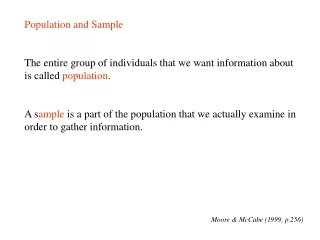
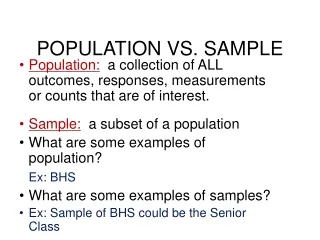
Vocabulary • population • sample • data point • frequency distribution • relative frequency • grouped data • histogram
Constructing a Frequency Distribution • Choose either individual data points or four to eight evenly spaced intervals (if there are several different values). • Tally the number of data point or each individual point or in each interval. • List the frequency of each individual data point or interval. • Find the relative frequency of each data point (or interval) by dividing the relative frequency by the total number of data points.
Make a frequency distribution to summarize the ages of the students in this class and construct a histogram to illustrate the data.
The weights, in pounds, of 35 packages of ground beef at the Cut Above Market were as follows:
Organize the given data by creating a frequency distribution. (Group the data into six intervals.)
In order to examine the effects of a new registration system, a campus newspaper asked freshmen how long they had to wait in a registration line. The frequency distribution on the next slide summarizes the responses. Construct a histogram to represent the data.
The frequency distribution below lists the number of hours per day that a randomly selected sample of teenagers spent watching television.
Where possible, determine what percent of the teenagers spent the following number of hours watching television. • less than 4 hours • not less than 6 hours • at least 2 hours • less than 2 hours • at least 4 hours but less than 8 hours • more than 3.5 hours
Count the number of each color of m&ms and make a frequency distribution to summarize the information and construct a histogram to illustrate the data.