Download

1 / 7
80 likes | 190 Vues
This study performs a comprehensive regression analysis of gas consumption data from Small Supply Points spanning March 2005 to March 2011. The analysis employs various dummy and weather variables while addressing data cleansing issues, including the removal of outliers. The regression model shows a Mean Absolute Percentage Error (MAPE) of 10% overall, with seasonal variations noted. Future work is proposed to enhance model accuracy by refining variables, substituting missing weather data, and potentially introducing lagged weather effects to improve predictions.

E N D
Option C: Regression Analysis NDM Data Sample
Data collation • Raw data ranging from March 2005 to March 2011. • Gas consumption at Small Supply Points (i.e., EUC 1,2,3 and 4), contained in “SMNDM_AQ_xxxx.txt” files, was aggregated by EUC, LDZ and by day. • No data at LDZ WN for EUC 1. • At LDZ NW, data ranging from 23rd March 2009 to 20th October 2009 missing. • No data yet collated for Large Supply Points.
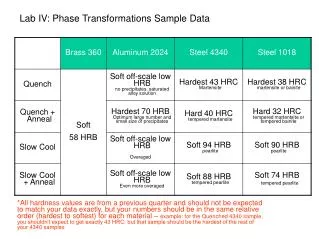
Data Cleansing • Due to overlapping time windows below, incoherent data were removed as collectively agreed on 2nd May • At LDZ NW, further data deleted due to sudden doubling in consumption (i.e., outliers). Dates range from 17th March 2009 to 21st October 2009. Total of 7 data points removed.
Regression Analysis • Regression Model as follows: • Dummy variables (Bank Holidays, Easter, Christmas and so forth). • Weather variables introduced as per DESC meeting on 4th April (e.g. Temperature, Global Radiation, Rainfall and so forth). • Time intervals used based on office hours and domestic habits. • Slot 1 from 5am to 8am • Slot 2 from 9am to 4pm • Slot 3 from 5pm to 10pm • Slot 4 from 11pm to 4am
Regression Analysis • Data normalised by AQ because of erratic level changes observed year on year. Yearly cut-off date is of 1st April due to time span of original files and data deletion process • Permutation of 14 Variables used to seek out best Regression fit.
Conclusion • MAPE of 10% overall across all LDZ’s. • Over Winter months (October-April), overall MAPE is of 8%. • Over Summer months (May-September), overall MAPE of 13.5%. • Regression analysis suggests that, overall, these variables are significant: • Mean_WindDirection • Slot1_Windspeed • Slot3_Windspeed • Slot3_GlobalRadiation • Slot4_Temp • Bank Holidays • School Holidays • CWV • mean_Temp • mean_Rainfall
Discussion of future work • Removal of non-significant parameters and fine-tuning of regression analysis. • For LDZ NW, weather parameters missing. Weather substitution algorithm to be implemented? • Lagged weather effects may be introduced. • Investigation of power on explanatory variables. • Out-of-sample modelling upon receipt of 2011/2012 NDM Sample Data