Modeling Blue Crab Distribution in Chesapeake Bay: Factors Influencing Abundance
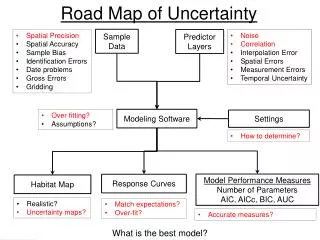
This study evaluates the distribution of Blue Crab (Callinectes sapidus) in Chesapeake Bay from December to March during the 1989-1990 sampling period. It employs a stratified random sampling method across three regions, analyzing over 1200 stations. Key predictors such as depth, salinity, water temperature, and distances from the bay mouth and submerged aquatic vegetation were assessed. The study utilized a two-stage generalized additive model to predict crab abundance and depth-related factors affecting their winter distribution, while employing kriging and logistic regression techniques for data analysis.

Modeling Blue Crab Distribution in Chesapeake Bay: Factors Influencing Abundance
E N D
Presentation Transcript
Sample Data • Non-commercial dredges • December to March • 1989-1990 • Sampling changed somewhat • 1255-1599 stratified random stations • 3 regions • >15mm carapace
Predictors • Depth • Salinity • Water temp • Distance from Bay Mouth • Distance to submerged aquatic vegetation • Slope • Bottom type not available
Predictors • Bottom temp and salinity • 99 to 123 sites per year • Kriging • Distance to Bay mouth • Lowest-cost path from 250m raster map • Slope • 30 meter bathymetry
Modeling • 75% training, 25% test • Stage I • Logistic: binomial error distribution, logit link • D=depth, M=distance to mouth, V=distance to veg, S=salinity, B=bottom slope, T=temp • Stage II: female density sites >=1 crab • Abundance:
Distance From Mouth
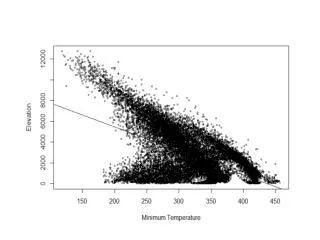
Blue Crab vs. Salinity Jensen et. al. 2005, Winter distribution of blue crab Callinectessapidus in Chesapeake Bay: application and cross-validation of a two-stage generalized additive model