
Integrated Analysis of Gene Expression and e-QTL Mapping Across a Mapping Population
Explore gene expression and e-QTL for all genes in individuals using a gene summation and network averaging approach. Identify e-QTL positions across the genome, group genes into networks, and calculate averages for individual networks to map e-QTL. Evaluate genomic positions, LOD scores, and the percentage of genes with e-QTL.

Integrated Analysis of Gene Expression and e-QTL Mapping Across a Mapping Population
E N D
Presentation Transcript
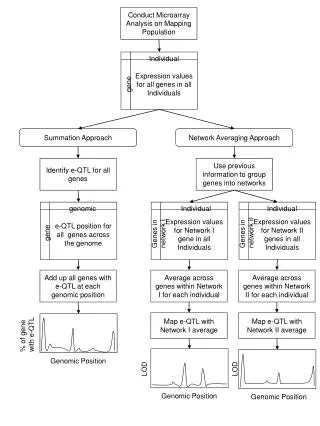
Conduct Microarray Analysis on Mapping Population Expression values for all genes in all Individuals Individual gene Summation Approach Network Averaging Approach Identify e-QTL for all genes Use previous information to group genes into networks e-QTL position for all genes across the genome genomic Expression values for Network I gene in all Individuals Individual Expression values for Network II genes in all Individuals Individual Genes in network I Genes in network II gene Add up all genes with e-QTL at each genomic position Average across genes within Network I for each individual Average across genes within Network II for each individual Map e-QTL with Network I average Map e-QTL with Network II average % of gene with e-QTL Genomic Position LOD LOD Genomic Position Genomic Position