Download
1 / 32
320 likes | 345 Vues
This lecture focuses on the discussion of maps and the atmospheric circulation and pressure distributions. It covers topics like the formation of lows in a trough over Alberta, Rossby waves, synoptic-scale and meso-scale wind systems, Chinook and sea breeze, and El Nino. The lecture provides examples and visuals to explain these concepts.

E N D
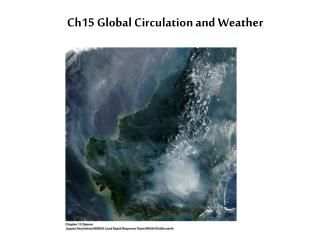
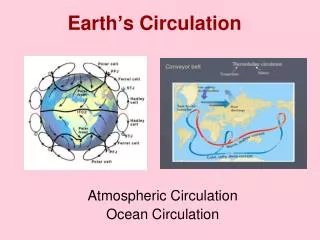
Lecture 18: Map discussion + Atmospheric circulation & pressure distrib’ns (Ch 8) • map discussion; focus on series of lows forming in trough over Ab this week (powerpoint “animation”) • Rossby waves • Chinook and sea breeze – examples of a synoptic-scale and of a meso-scale wind system • El Nino
We’ve had a week I would characterize as cool, moist, cloudy, calm. We’ve had drizzle, a few flakes of snow, a frost one morning. Let’s focus on Thursday 19 Oct…
at or near saturation • absolutely stable layers • NW wind all levels
widespread low cloud • (not very different Friday)
Let’s watch the progression of a trough across BC into Alberta… … and formation of surface lows… 00Z Wed 18 Oct. Why? Because science can be said to be all about recognizing, recording and (if possible) explaining patterns … no patterns? … then not possible to “do” science. This is one of the Ab weather “patterns” Path of “this” low
Let’s watch the progression of a trough across BC into Alberta… … and formation of surface lows… 06Z Wed 18 Oct.
Let’s watch the progression of a trough across BC into Alberta… … and formation of surface lows… 12Z Wed 18 Oct.
Let’s watch the progression of a trough across BC into Alberta… … and formation of surface lows… 18Z Wed 18 Oct.
Let’s watch the progression of a trough across BC into Alberta… … and formation of surface lows… 00Z Thurs 19 Oct.
Let’s watch the progression of a trough across BC into Alberta… … and formation of surface lows… 06Z Thurs 19 Oct.
Let’s watch the progression of a trough across BC into Alberta… … and formation of surface lows… Edmonton: (T=) 0 (Td=) 0 ie. sfc chart gives Td directly 12Z Thurs 19 Oct.
Let’s watch the progression of a trough across BC into Alberta… … and formation of surface lows… 18Z Thurs 19 Oct.
Let’s watch the progression of a trough across BC into Alberta… … and formation of surface lows… 00Z Fri 20 Oct.
Let’s watch the progression of a trough across BC into Alberta… … and formation of surface lows… 06Z Fri 20 Oct.
Let’s watch the progression of a trough across BC into Alberta… … and formation of surface lows… 12Z Fri 20 Oct.
12Z Thurs 19 Oct. During these events, consistently low pressure at all levels in eastern Canada
Edmonton: (T=) -7 (T-Td=) 0 ie. upper charts give T and T-Td 12Z Thurs 19 Oct. This ridge moves eastward by Fri 3x5+2.5 m/s Heavy stippling on 700 mb analysis: T-Td <= 2oC
Edmonton: (T=) -9 (T-Td=) 1 ie. upper charts give T and T-Td 12Z Fri 20 Oct. 2x5+2.5 m/s Heavy stippling on 700 mb analysis: T-Td <= 2oC
12Z Thurs 19 Oct. • note the weak ridge • and NW flow onto AB
L div con con div Waves in mid-latitude mid/upper troposphere causing convergence and divergence aloft... • Long (Planetary/Rossby) Waves — • wavelength 1000’s kilometers • typically 3 - 7 around globe (fewer, longer, stronger in winter) • not always unambiguously identifiable - but can be shown mathematically to exist • in ideal atmos. due to N-S variation of Coriolis force • (usually) move slowly eastward 500 mb
Example of high amplitude Rossby wave over N. America Edmonton low +4oC, high +20oC Winnipeg low -2oC, high +11oC Fig. 8-13 Sept. 22, 1995
Rossby wave moving eastward Fig. 8-12
Rossby wave moving eastward Notice the “short wave” here; covered later – are associated with storms
Foehn/Chinook/etc. – synoptic scale wind down mountain slope “when winds warmed by compression descend the eastern slopes of the Rocky Mountains in North America, they are called Chinooks” (native-American term meaning “snow-eater”). Condensation of vapour on the windward slopes also contributes to the warmth of the dry, descending lee-side current “Low-pressure systems east of the mountains cause these strong winds to descend the eastern slopes…” Warm lee current may ride above a layer of cold dense air on the lee side… frontal boundary may move back and forth – rapid temperature changes
Strong SW 700 mb flow strikes mountains perpendicularly Warm air at 850 mb in lee of Rockies (adiabatic compression)… “trowal” Chinook conditions in SW Alberta Surface lee trough of low pressure; tight contours, windy.
Sea breeze Fig. 8-24 • mesoscale • caused by differential warming (“thermally driven”) • shallow circulation • masked (ie. effect over-ridden) by strong synoptic-scale winds
So potentially can be forecast by coupled oc/atmos prediction model El Nino/ La Nina • ENSO an internally-generated disruption or instability of the ocean-atmosphere system in the tropical Pacific having important consequences for weather around the globe and giving some basis for long range weather forecasting (though presently with low skill) • Is connected with the Southern-Oscillation, a pattern of reversing sea-level east-west pressure gradient across the equatorial Pacific… El Niño and La Niña are opposite phases of the El Niño-Southern Oscillation (ENSO) Fig. 8-27
Normal conditions • easterly Pacific tradewinds pile up warm surface water in the west Pacific - so that sea surface is about 1/2 meter higher at Indonesia than at Ecuador. A weak surface ocean counter-current then develops • The sea surface temperature is about 8oC higher in the west, with cool temperatures off South America, due to an upwelling of cold (nutrient-rich) water from deeper levels • strong convection/rain over the warmest water, and the east Pacific is relatively dry • strong equatorward-flowing coastal current (“Humboldt” or “Peruvian”) sustains the upwelling cold deep-water Equivalent to Fig. 8-17, for S. hemisphere JDW, EAS, U. Alberta EAS270 22 Nov/04
El Nino phase • Reversal in sea-level east-west pressure gradient across equatorial Pacific. Abnormal winds (weakened easterly trades, or even westerlies) • The warm surface water normally found in the western equatorial Pacific “sloshes eastward”, and the warm sea surface temperature anomaly in the eastern Pacific suppresses upwelling of cold deep-water Fig. 8-29… sea sfc temperature anomaly averaged over eight El-Nino’s (red = + 2oC)
La Nina phase • La Niña phase is characterized by unusually cold ocean temperatures in the eastern equatorial Pacific Fig. 8-31… sea sfc temperature anomaly averaged over eight La-Nina’s (blues, about = minus 1oC)