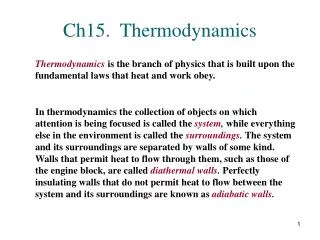
Ch15 Global Circulation and Weather
830 likes | 2.01k Vues
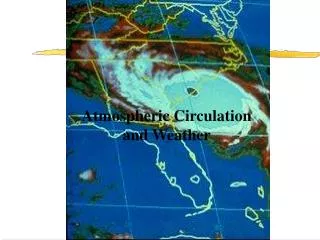
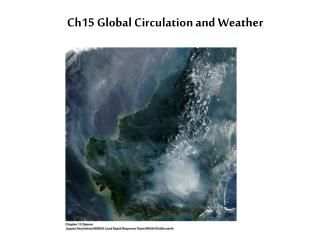
Ch15 Global Circulation and Weather. Weather patterns are caused by differential heating of the Earth’s surface, both on a local and a global scale. Atmospheric Pressure .

Ch15 Global Circulation and Weather
E N D
Presentation Transcript
Weather patterns are caused by differential heating of the Earth’s surface, both on a local and a global scale
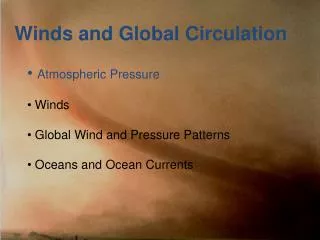
Atmospheric Pressure Defined as the force per unit area exerted on any surface by the weight of the overlying air column. At sea level, the atmosphere exerts an average of 14.7 pounds of force on a one-by-one inch area (slightly bigger than a postage stamp). Atmospheric pressure decreases with altitude, since gravity pulls air molecules towards the earth.
Atmospheric pressure units Atmospheric pressure is often measured in millibars (1000 mb = 1 bar). Standard pressure at sea level is 1.0132 bar or 1013.2 mb, often rounded to 1000 mb. American pilots and TV weatherman express atmospheric pressure in “inches mercury” where 29.9 inches = standard pressure at sea level. Atmospheric pressure is often called barometric pressure, and it is measured with a barometer.
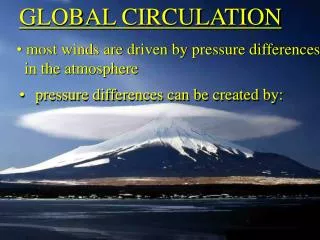
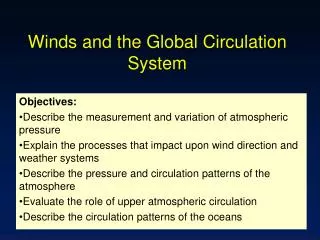
Pressure and wind • Wind – movement of air from high to low pressure areas. • Wind is caused by pressure differences due to unequal heating of Earth’s atmosphere
Cold air is more dense than warm and exerts more Pressure than warm air at a given altitude
Isobars-Lines of Equal Pressure Drawn at the earth’s surface (there are upper-level charts as well) Corrected to “sea level” so only effects of weather shown, not elevation Units are millibars (mb) where 1013 mb is standard sea-level pressure. Note that lows and highs appear the same; like a bullseye. Look at numbers (and big H or L) to determine which is which.
Isobars-Lines of Equal Pressure Wind flags: Winds blow away from the flags and towards the dots Winds blow from high pressure to low pressure Winds blow towards the L, away from the H Although temperature infuences pressure, no real correlation Note that lows and highs appear the same; like a bullseye. Look at numbers (and big H or L) to determine which is which.
Santa Ana Conditions High pressure to our east and northeast drive winds from east to west
As these winds get pushed over the mountains, they undergo adiabatic compression, becoming hot and dry
Global Wind Patterns and the Coriolis Effect • Wind blows from high to low pressure • Wind blows straight in one direction, but earth turns underneath • We experience the wind as curving, not us moving! • This apparent “turning force” is the Coriolis Effect.
Global Wind Patterns and the Coriolis Effect • If you stand behind the wind and watch it move away from you in the N. Hemisphere, it appears to curve to the right • If you stand behind the wind and watch it move away from you in the S. Hemisphere, it appears to curve to the left.
Cyclones and Anticyclones • Regions of local pressure highs and lows have characteristic circulation patterns • Cyclones: local low pressure centers: Air spirals inward and upward • Anticyclones: local high pressure centers: Air spirals outward and downward
Air Movement at a Cyclone (Low) Warm (or humid) air is less dense than cold air and therefore exerts lower pressure Rising warm air undergoes expansional (adiabatic) cooling which causes clouds and rain. Low surface pressure associated with unsettled weather and rain.
Pressure and wind Cool (or dry) air is denser than warm This air exerts a higher pressure than warm air and will tend to sink, Compressional (adiabatic) warming prevents saturation and cloud formation High pressure often associated with good weather
Isobars-Lines of Equal Pressure Wind flags: Winds blow away from the flags and towards the dots. Wind spirals in a counterclockwise direction around the L. Wind spirals in a clockwise direction around the H. Note that lows and highs appear the same; like a bullseye. Look at numbers (and big H or L) to determine which is which.
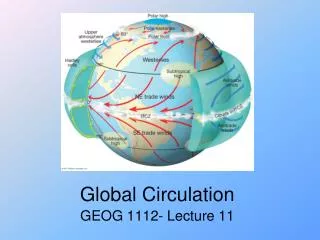
Global Circulation and the 3-cell model • Global circulation patterns are created by differential heating and modified by the Coriolis Effect. • Idealized atmospheric model: 3 convection cells in each hemisphere: • Hadley Cell (tropical) • Ferrel Cell (mid-latitude) • Polar Cell • Note warmer air at surface for all cells
Global atmospheric circulation ITCZ The equatorial low pressure is due to rising warm equatorial air Adiabatic expansions causes the frequent rainfall. It rains a lot in the tropics! Returning air from the Hadley Cell converges at the Intertropical Convergence Zone (ITCZ). Since air is rising up after converging at the ITCZ, there is little wind, hence the sailor’s term: “the “doldrums”.
Global atmospheric circulation –Trade Winds • Leg of Hadley Cell closest to Earth’s surface is pushed west by Coriolis Effect. • results are winds that curve in from the east and converge at the ITCZ. • These are the easterly trade winds (coming from NE in the northern hemisphere; from SE in the southern hemisphere). • Trade winds drive surface equatorial ocean currents in the tropics.
Global atmospheric circulation – subtropical high pressure ~30o N/S latitude, air from the Hadley Cell lost some heat and much moisture, so falls Adiabatic compression causes hot dry air and high pressure at the surface – a subtropical high pressure zone in both northern and southern hemispheres. Much of the world’s deserts are located in this part of the world. San Diego’s latitude is approximately 33°N. It’s climate is influenced by the high pressure belt.
Global Circulation in the Mid-latitudes The boundary between Hadley and Ferrel Cells is located at about 30° N/S latitude. Warm, dry air descending at this junction diverges NE/SE trade winds go towards the Equator. Other branch goes towards the N/S pole and is deflected to the East by the Coriolis Force. Since they blow from the west, these winds are called the Westerlies.
Global Circulation– The Polar Cell • The cold pole creates permanent high pressure at the N/S Pole) • Polar easterlies from descending polar air • Rising air from the junction of the Ferrel and Polar Cells create a region of stormy, unsettled weather at about 60° N/S • Polar jet stream– forms along the polar front.
Polar Cell Circulation We’re here!
Upper Level Circulation: Winds aloft – 30-40,000 ft agl • Upper-level wind patterns: • Weak equatorial easterlies • Tropical high pressure belts • Upper-air westerlies • Polar low • Polar front – boundary between upper-air westerlies and the polar easterlies (low pressure) • Rossby Waves – refer to the meandering waves made by the upper-air westerlies along the polar front
Winds in the Upper AtmosphereRossby Waves and the Jet Stream
Winds in the Upper AtmosphereRossby Waves and the Jet Stream
Winds in the Upper AtmosphereRossby Waves and the Jet Stream
Winds in the Upper AtmosphereRossby Waves and the Jet Stream
Winds in the Upper AtmosphereJet Streams • Wind streams • At high altitude • In a narrow corridor • Speeds are maximum toward the center • The jet stream located closest to each pole is the polar-front jet stream
Air masses large body of air with uniform temperature and moisture characteristics over a large area. retain integrity for several days before mixing. Source region origin of the air mass give air mass its characteristics
Fronts • Sharply-defined boundary between a 2 air masses with different characteristics • Fronts may be warm, cold, occluded (closed) or stationary • Cause weather systems – cyclonic, or frontal precipitation
Warm Fronts • Moving warm air mass overtakes a stationary or slow-moving cold air mass. • Warm air rises over the cooler air and cools adiabatically • Lifting process is called frontal wedging.
Warm Fronts Commonly, warm fronts are slow moving, producing stable conditions stratus type clouds (no vertical development) steady precipitation
Warm Fronts if the warm air mass is unstable (pushed up too quickly), cumulonimbus clouds and thunderstorms result (not shown here).
Map symbol for Warm Front – half circles on the side of rising air – move generally north in n. hemisphere
Cold Front • Cold front – fast-moving cold air overtakes warm air and shoves underneath it, creating a steep contact (frontal wedging, again) • Warm air rises rapidly, causing unstable conditions
Cold Front Result is cumulus and cumulonimbus cloud formation (clouds with significant vertical development) Showery precipitation/ thunderstorms Cold clear weather after the front passes.
Map symbol for cold front – triangle on the side of descending air – move south and east in N. hemisphere
Occluded Front (Cutoff Low) Faster moving cold air mass traps a warm air mass against a second cold (or at least cool) air mass. Note the more gently-sloping warm front compared to the more steeply-sloping cold front and the different weather patterns resulting from them.
Occluded Front (Cutoff Low) Warm air is completely cut off from the surface. Precipitation occurs along both frontal boundaries narrow band of heavy, possible convective precipitation along former cold front wider band of steady precipitation at warm front Net result is large zone of inclement weather. Continues until “cutoff” warm air mass runs out of moisture.
Map symbol for occluded front – alternating half circles and triangles on the same side
Mid-latitude Wave Cyclones Initial conditions: Along the polar front, cold polar air mass from the north (cP or mP) meets warm humid subtropical air mass from the south (mT). No relative movement between the air masses – yet.
Mid-latitude Wave Cyclones (1) An undulation or disturbance causes cold air to push southeast and warm air to push north. This results in 2 fronts and a counter-clockwise circulation pattern.
Mid-latitude Wave Cyclones (1) An undulation or disturbance causes cold air to push southeast and warm air to push north. This results in 2 fronts and a counter-clockwise circulation pattern. This is the case for the location marked #1.