Groningen : Expert workshop Input-Output tables
210 likes | 342 Vues
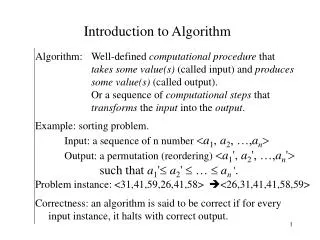
Groningen : Expert workshop Input-Output tables. Valuation matrices in the Finnish supply and use tables. Antti Pasanen 15-16 September 2005. Starting point for the compilation of valuation matrices.

Groningen : Expert workshop Input-Output tables
E N D
Presentation Transcript
Groningen: Expert workshop Input-Output tables • Valuation matrices in the Finnish supply and use tables. • Antti Pasanen • 15-16 September 2005
Starting point for the compilation of valuation matrices • Some 93% of the domestic supply at basic prices on the diagonal of the supply table and some 7% not yet determined (secondary production). • Imports by product existed already and made about 13% of the total. So about 4% of the total supply was not yet defined. • On the use side at purchaser’s prices the best information for the final uses were: Exports, household consumption expenditure, other consumption expenditure (government, non-profit institutions) and capital formation. • Intermediate consumption was added to the use table with breakdown of industry totals to products (1995 breakdown levels).
Valuation matrices • Imports • cif • Use table • at • purchasers’ • prices Valuation matrices VAT Other taxes on products Subsidies on products Customs Trade and transp. margins • Use table at basic prices • Imports • at basic • prices • Use table of domestic production at basic prices
VAT A list of VAT –percentages by product, when full VAT is paid, is compiled on the basis of the legislation. These percentages are used in all the uses that are not included in the exceptions. (In Finland VAT legislation only came into effect 1.6.1994, before VAT we had sales tax\turn over tax) Main exceptions (This is a simplified version) 1. Intermediate inputs The proportion of output for which VAT is not charged is calculated for each of the industries. This gives, by industry, the proportion of intermediate inputs on which VAT is paid.
VAT (continued...) 2. Private consumption expenditures The purchases of tax-free products (hotel and restaurant etc.) by households is used to reduce VAT-percentage of these products in private consumption 3. Investment The share of investment from activities not liable to charge VAT is calculated. This gives the proportion of investment expenditure on which VAT is paid.
VAT example (continued...) • Industry totals by sector at basic prices • Charged VAT in the supply of the products
VAT example (continued...) • Calculation of the non-deductible VAT shares • Compilation of the corrected VAT percents and VAT value
Turn over tax • Calculated like other taxes on products • No deduction right (all non-deductible) • Is not paid for all services • Is paid from goods and services included to goods
The actual compilation is done by the compilation rule variable. Compilation rule depends on the available data and legislation. For other product taxes (excluding VAT and customs) proportional shares are calculated using accumulation information from government’s financial records and legislation (which uses and products are under taxation) Taxes on products have six compilation rules (1,4,6,7,8 and 9) Proportional shares for the subsidies can be calculated from the payment information's which are already collected for each product separately Subsidies on products have three compilation rules (1,6 and 9) Other taxes on products and subsidies on products
Other taxes on products: Energy tax Fuel tax Oil waste tax Car and motorcycle tax Asset transfer tax Alcohol tax Tobacco tax Soft drink tax Pharmacy fee Lottery tax Subsidies on products: Agricultural products export subsidies Agricultural products CAP and national subsidies Agricultural program based subsidies Public transport subsidies Publishing Storage loss compensations Other taxes on products and subsidies on products (continued...)
Other taxes on products and subsidies on products (continued...) • Table 1. A part of a product tax table • on spirits (159110) the tax was roughly 592% of the basic price • In this case the compilation rule is 9 which means, that the uses where tax percentage (from basic price) is not applied are listed • Supply: all denaturated spirits except all products beginning with 159 (alcohol suitable for drinking) regardless of industry and supply type • Value of the collected taxes (1348,2Me) is obtained from government’s financial records and it’s divided to alcoholic products supply with the proportions obtained from the use of the products
Customs • Collected customs are obtained directly from the board of Customs for each product separately • Customs are calculated from purchaser's prices without VAT and in the calculation we assume that EU and Non-EU imports are divided evenly • The only operation is the product classification modification
Compilation of trade and transport margins • Before compiling the trade and transport margins we needed to compare the difference of supply and use by product • In the supply table the unknown part of the supply by product needed to be scaled up (some 7% of the domestic supply and some 4% of the total supply) • at the total econony level and proportionally to the known supply by product • The remaining difference between the supply and use of a good was now an estimate for the value of trade and transport margins by good
Compilation of trade and transport margins (continued...) • Some assumptions on margins had to be made: • Assumptions on trade margins giving an idea of the different uses where each kind of trade margin could have been used • Industry specific knowledge that of course varies by country • We assumed that some of the industries pay no trade margins in their intermediate consumption and that some pay the wholesale margin for some or all products they use as intermediate inputs and some industries even pay retail margin on some specific products.
Compilation of trade and transport margins (continued...) • Other assumptions were that most of the retail margins (besides the very specific ones in intermediate consumption) are paid by households, and that the changes in retail trade inventories include a wholesale margin. • The most crucial assumption was that no transport margin is paid if there’s trade margin in the purchaser’s price value of good. • In this case it is assumed that the trade margin includes all the transportation costs.
Compilation of trade and transport margins (continued...) • This allowed us to use the differences noted above as weights first to breakdown the total value of each supply trade margin to goods and then break these values further down to different uses of these goods by using the purchaser’s price value of each individual use as the weight. • We of course obtained the transport margins from the uses where there were no trade margins. • As a final step, it had to be made sure that trade and transport margins were not greater than the (domestic) supply for these services.
Compilation of trade and transport margins (continued...) • Estimation of combined trade and transport margins by product • Distribution of trade and transport margins by user and by product
Transport margins • Road, railway, water, air and pipeline transportation information’s are collected from different transport statistics • All the transportation services don’t constitute transport margin so the procedure is a little more complicated: • separately invoiced input transports by goods are calculated • the value is divided into transport services by joining traffic statistics to the product information’s • As a result proportional shares for the transport margins are obtained
Use at basic price • With the procedures described in previous slides the preliminary valuation matrices are calculated • Valuation matrices can then be joined to the use matrix at purchaser´s prices and preliminary use tables at basic prices can be computed • The final version requires balancing (manual and RAS) of the system by product at basic prices and balancing of the margins (differences in the margins are very small at this point)