Fatigue
Fatigue. Outline. Fatigue concepts Durability testing Stress-life fatigue Strain-life fatigue Fatigue crack growth Flaw-tolerant design Component testing Nitinol Fatigue Fatigue Analysis: FDA Review. Fatigue Concepts. Definition of Fatigue:


Fatigue
E N D
Presentation Transcript
Outline • Fatigue concepts • Durability testing • Stress-life fatigue • Strain-life fatigue • Fatigue crack growth • Flaw-tolerant design • Component testing • Nitinol Fatigue • Fatigue Analysis: FDA Review
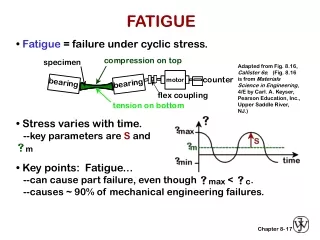
Fatigue Concepts Definition of Fatigue: • The process of progressive, localized permanent structural change that occurs in a material subjected to cyclic loading • Fatigue can and does occur at stresses well below a given material’s yield strength
Fatigue Concepts Fatigue crack initiation: • Requires local plastic deformation, usually at a stress concentration location or a properly oriented grain • Slip along slip bands- plane of maximum shear • Formation of intrusions and extrusions • Cracks form along slip planes
Fatigue Concepts Fatigue crack initiation: • Often occurs at local stress discontinuities: notches, voids, inclusions, etc. • Affected by surface preparation and roughness • Affected by residual stresses • Affected by material strength, in general, the higher the tensile strength, the higher the resistance to fatigue
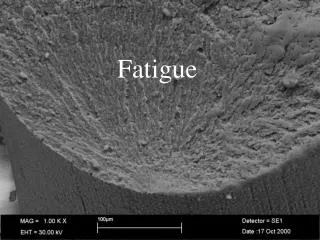
Fatigue Concepts Fatigue Crack Growth - Striation formation model
Fatigue Concepts Design for Fatigue Prevention: • Durability testing • Stress-life approach • Strain-life approach • Fatigue crack propagation approach (LEFM-based damage tolerant design) • Component-based stress/strain-life testing
Durability Testing • Testing to a given number of cycles (often 10 to 15-year life) • Tests conducted under simulated, conservative in vivo conditions • Typically relies on stress analysis (FEA) to estimate test loads/ deflections or stress/ strains • “Pass/fail” test • Typically large number of samples (e.g. 29 samples gives 90% reliability with 95% confidence) • Can take months to complete
Durability Testing Pros • Verifies long-term fatigue life Cons • If successful, does not establish (or replicate) a failure mode • Does not establish a safety margin • Does not allow for quantitative comparisons between designs, surface finishes, heat treatment, etc. • High test frequencies do not replicate corrosion fatigue conditions
Stress-Life Fatigue stress range, σr = σmax – σminstress amplitude, σa = (σmax – σmin)/2mean stress, σo = (σmax + σmin)/2Stress ratio, R = σmin/ σmax
Stress-Life Fatigue S-N behavior can also be expressed with a power-law equation (linear line on log-log plot – aka Basquin relation): σa = true stress amplitude2Nf = reversals to failure (1cycle = 2 reversals)σ'f = fatigue strength coefficient (approximately equal to true fracture strength)b = fatigue strength exponent
Stress-Life Fatigue • How do you design a part if your R ratio (mean stress/strain) is different than your S-N data? • Use Goodman, Gerber, or Soderberg relations • Note that this mean stress/strain technique is not applicable to superelastic nitinol (to be discussed later)
Stress-Life Fatigue Line a = Soderberg relation: Sa = Scr(1-So/Sy)Line b = Modified Goodman relation: Sa = Scr(1-So/Su)Line c = Gerber relation: Sa = [Scr(1-So/Su)2]Line d = Goodman relation modified with σf
Stress-Life Fatigue • Soderberg relation is the most conservative • Goodman is frequently used for brittle metals, and is generally considered conservative for ductile metals • Gerber relation generally has good agreement for ductile metals • Improved agreement for Goodman and Gerber using true fracture strength instead of ultimate tensile strength
Stress-Life Fatigue Variable amplitude loading: Palmgren-Miner Rule: ΣNj/Nfj = 1
Strain-Life Fatigue • Uses cyclic stress-strain curve to obtain strain versus life • Elastic and plastic strain considered separately, then summed • Considers plastic deformation that may occur in localized regions (instead of nominal stresses and stress concentration factors as in stress-life) • Called the “Coffin-Manson” approach
Strain-Life Fatigue Most materials display metastable cyclic stress strain behavior when subjected to cyclic loading • Cyclic strain hardening • Cyclic strain softening
Strain-Life Fatigue Cyclic Strain Hardening:
Strain-Life Fatigue Cyclic Strain Softening
Fatigue Crack Growth • “Damage” or “flaw” tolerant design method • Analysis of growing cracks based on linear elastic fracture mechanics • Assume a structural component contains cracks, all smaller than the minimum detectable length (ad) • Ensure insufficient stress to cause minimum detectable crack to grow (fatigue threshold, ΔKth approach), or insufficient cycles to grow crack to critical length for fracture (ac) over lifetime • Aircraft, nuclear industries use approach where inspection intervals are much shorter than time required to grow from ad to ac.
ac Crack length, a da/dN ad Cycles, N Fatigue Crack Growth Fatigue crack growth under constant amplitude loading:
Fatigue Crack Growth Apply linear-elastic fracture mechanics to crack growth (Paul Paris – 1960s, from Boeing) General form: Apply to fatigue use stress range, Δσ: Units are ksi(in)1/2 or Mpa(m)1/2
R= -1/2 R=0 R=1/2 da/dN R= -1 ΔK Fatigue Crack Growth Effect of mean stress on fatigue crack growth (typically described as the R ratio, σmin/σmax): Note: compressive stress does not contribute to crack growth except in very ductile materials –crack closure effects
10 example ΔKth 1 0 1 Fatigue Crack Growth Effects of stress ratio (R) on ΔKth: ΔKthis highest near R=0, typical ΔKthvalues range from 1 to 15 ksi(in)1/2 R
Flaw Tolerant Design Limitations of da/dN technique for medical devices: • Plasticity: if plastic zone ahead of crack is very large compared to specimen or component thickness, linear-elastic fracture mechanics may not apply. Given small sizes of many devices, needs to be examined. • Minimum detectable crack/flaw size for ΔKth may be impractical/too costly to detect • Small crack behavior: if a crack is sufficiently small, it can interact with the microstructure and grow faster than predicted by da/dN versus ΔK
Flaw Tolerant Design Small v. Short cracks: • Small cracks have dimensions on the microstructural scale – e.g. grain size • Short cracks have one dimension that is large compared to the microstructure
Flaw Tolerant Design Small crack da/dN v. ΔK behavior: ASM Metals Handbook, Vol. 19
Flaw Tolerant Design So, how small is a small crack?? One method: lo transition between “small” and “long” crack behavior Example: for typical cobalt-chrome alloy, lo ~ 200 microns!! El Haddad, M.H., Smith, K.N., Topper, T.H., “Fatigue Crack Propagation of Short Cracks”, Journal of Engineering Materials and Technology, Transactions of the ASME, Paper No. 17-Mat-7, 1978, pp. 1-5.
Flaw Tolerant Design Grain structure in Co-Cr stent
Flaw Tolerant Design Another approach: • Ignore threshold and extend Paris Power Law region. • Still non-conservative for small cracks!
Flaw Tolerant Design Although problematic for small, metallic implants, flaw tolerant design is a valuable tool for fatigue validation of pyrolitic carbon heart valve occluders!:
Component Testing • Component fatigue testing is S-N or ε-N fatigue testing of many exemplar components to failure to determine/ validate fatigue properties • Advantage of component testing for medical devices is use of actual geometry, surface conditions, residual stresses • Component fatigue testing relies on principles of S-N and ε-N fatigue analysis • Medical device component fatigue validation also relies on finite element analysis to determine stresses and strains
Component Testing Example of Component Testing Process: Vascular Implant • Conduct load/ deflection-life testing of device (includes finished surface conditions, sterilization, expansion, etc.) • Generate load or deflection-life curve • Use finite element (FE) analysis to convert deflections (or loads) to stress and strain • Generate S-N or ε-N curve • Conduct statistical analysis of data • If mean stress/strain variation is a concern, generate Goodman-type relation • Conduct FE analysis of stresses or strains on device for conservative in-vivo condition, compare with fatigue performance to validate design
Stress Strain Fatigue in Typical Nitinol Stent Stent diameter Max pulsatile strain Crimped in catheter Expanded Stent Deployed
Fatigue in Typical Nitinol Stent Stress Strain Strain amplitude Mean strain
Nitinol Fatigue Behavior • Nitinol has excellent deflection/strain- control fatigue properties compared to other engineering/medical device alloys • Nitinol has marginal load/stress-control fatigue properties compared to other engineering/medical device alloys • Nitinol has poor fatigue crack threshold (ΔKTH) and fatigue crack growth properties compared to other engineering/medical device alloys
Nitinol Strain-Life Behavior 10M cycle strain-life properties at R=-1 Approximate 10M cycle strain-lives for other alloys: 0.09% L605 Co-Cr alloy0.22% Haynes 250.15% Annealed 316L stainless steel
Nitinol Strain-Life Behavior • The bulk of nitinol fatigue literature is for strain-life condition • Nitinol medical device applications are generally in strain or deflection control • Nitinol performs better in strain- or displacement-controlled fatigue than stress-controlled fatigue
Nitinol Strain-Life Behavior • Low cycle fatigue strength decreases with increasing test temperature • Higher SIM plateau stress as test temperature increases • High cycle fatigue strength not as sensitive to temperature Af = 283K Plot From Y.S. Kim and S. Miyazaki, “Fatigue Properties of Ti 50.9% at% Ni Shape Memory Wires”, SMST 1997
Mf < T < Ms T < Mf Ms < T < Md Ms < T < Md Ms < T < Md Ms < T < Md Ms < T < Md Ms < T < Md T > Md Nitinol Strain-Life Behavior Lower temperatures, lower plateaus, increased fatigue life Why? Lower stresses for strains within plateau region Plots from Pelton, et al. SMST 2000
Nitinol Strain-Life Behavior Effect of heat treatment: • Change in Af temperature – lower Af for constant test temperature decreases fatigue life • Thermo-mechanical treatment (creation of precipitates) can increase fatigue life and cyclic-induced superelastic response (Heckman) Plots from Heckman, et al. SMST 2001
Nitinol Strain-Life Behavior Effect of Mean Strain: • Many researchers have observed increased fatigue life with increased mean strain! • This effect is inconsistent with Goodman behavior observed in other engineering alloys Plot from: W. J. Harrison and Z.C. Lin, “The Study of Nitinol Bending Fatigue” SMST 2000
Nitinol Strain-Life Behavior Data generally indicates: • Tensile mean strains less than 1% reduce fatigue life • Compressive mean strains generally beneficial • Increased fatigue life for mean strains between 1 and 4% Plot from Pelton, et al. ASM 2003