Download
1 / 125
1.25k likes | 1.28k Vues
Learn about the history and parameters of solar power, including feed-in tariffs and merchant prices. Understand the computation of Levelized Cost of Electricity (LCOE) using capacity factor and carrying charge rate.

E N D
Merchant Prices in Germany • The feed-in tariffs were dramatically higher than wholesale prices of generation as shown in the graph. • The 45.70 (or Euro 450.7/MWH) is way off the chart. • The 9.47 or Euro 94.7/MWH is also off the scale.
Spanish Case and Political Risk • Higher or similar feed-in tariffs to Germany and much higher capacity factors. • Germany had limit on capacity, Spain did not. • Total Cost of 26.4 Billion Euros
Illustration of STC • If produced at full capacity factor (kWp) during the day and nothing at night, the capacity factor would be 50% and the yield would be 8760/2 = 4380. Just need solar patterns over the day. Don’t need anything else.
STC and Capacity Factor • Given that the STC at 1000 w/m2 defines the capacity, if you can find the average w/m2 for a year you can compute the capacity factor before the performance ratio: • If you have annual data on the kWh that hits a plane (a horizontal plane or an inclined plane), then the average per hour is the total divided by 8760. • If you have average daily data you can divide the number by 24
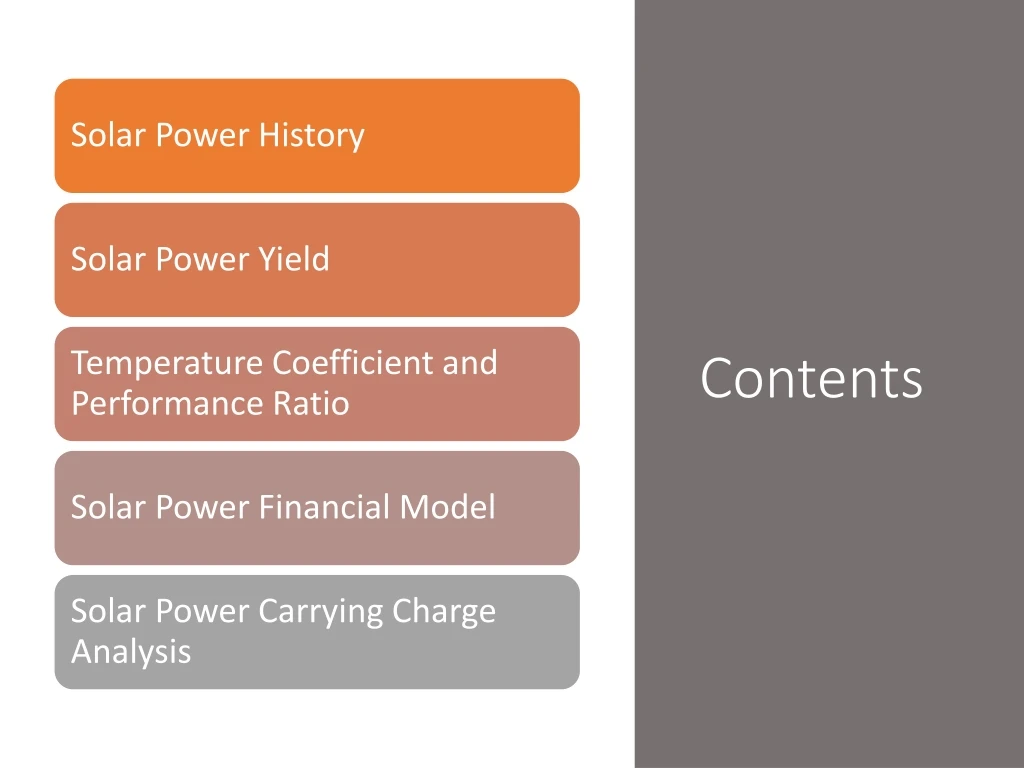
LCOE Points • Understanding how to compute levelised cost per MWH from fixed and variable costs using the capacity factor • Use of a carrying charge rate to summarise financial ratios and project finance parameters • Effect of different drivers for different power plants • Importance of carrying charge rates for capital intensive plants
LCOE Discussion • As the off-taker evaluates alternative PPA bids with levelized cost of electricity (LCOE), understanding details of the LCOE calculation is important. Basic calculation of the LCOE can be derived from factors that include the capital cost per kW, the capacity factor, the O&M costs, the fuel costs and the carrying charge rate. • The carrying charge can be computed as the EBITDA divided by the capital cost of the plant or it can be computed from the project IRR of the project with the PMT function. The carrying charge is driven by the required equity IRR, the debt cost, the debt tenor, the debt level and the tax rate. • The panel below shows where to find an example of using the different cost drivers to compute the LCOE and the right panel illustrates the effect of financial parameters on the LCOE. The first diagram illustrates short-run marginal cost with a supply curve and the second diagram shows an example of computing long-run marginal cost.
Introduction to LCOE • Eight Factors that drive LCOE of electric generating facilities ranging from solar projects to NGCC projects • Understanding how to compute levelised cost per MWH from fixed and variable costs using the capacity factor • Use of a carrying charge rate to summarise financial ratios and project finance parameters • Effect of different drivers for different power plants • Importance of carrying charge rates for capital intensive plants
Basic Equations for Revenue Build Up • Electricity plants have capacity which is the ability to produce at an instant • kW, mW, W • For producing revenue, there must be some kind of time dimension attached to the capacity • Hours, months, years • kW x h, kW x month, kW x year • kWh, kW-month, kW-year • There is a basic distinction in project finance for availability and output based projects. Output base projects earn revenues on production, availability based projects earn revenue as long as the plant is available to produce even if it does not produce. • Output based projects (renewable): revenue = price x kWh • Availability based projects (dispatchable): revenue = price x kW-month
Step 1 of LCOE: Annual Carrying Charge per kW • Convert the Cost per kW which is the crucial driver of power costs for many technologies by the carrying charge rate. This gives the cost per kW-year. The carrying charge can be thought of as the amount of annual EBITDA required for an amount of up-front cost. It can also be thought of as the return on and the return of capital to carry the investment. It can also be thought of like the loan payment on a house divided by the price of the house. • Annual Carrying Charges = Cost/kW x Carrying Charge Rate
Step 2: Total Fixed Cost per kW-year • Add the fixed O&M costs expressed in Amount (e.g. USD) per kW-year to the annual carrying charges to derive the total annual cost per kW-year. • Total Annual Fixed Cost/kW-year = Annual Carrying Charges + Fixed O&M Cost
Step 3: Compute the Fixed Cost to Turn on the Lights • Compute the total fixed cost based on energy rather than capacity. To do this, you need the capacity factor (for renewable) or the availability factor for base load (assuming the plant will run whenever it is available). The hours that must be covered by the fixed cost are 8766 x capacity factor. The total annual fixed cost per MWH as the annual cost x 1000 divided by 8766 x capacity factor. • Total Annual Fixed Cost/MWH = Total Fixed Cost/kW-year x 1000/ (8766 x CF)
LCOE Calculation – Calculation of Cost per MWH • Compute the total fixed cost based on energy rather than capacity. To do this, you need the capacity factor (for renewable) or the availability factor for base load (assuming the plant will run whenever it is available). The hours that must be covered by the fixed cost are 8766 x capacity factor. The total annual fixed cost per MWH as the annual cost x 1000 divided by 8766 x capacity factor. • Total Annual Fixed Cost/MWH = Total Fixed Cost/kW-year x 1000/ (8766 x CF) • Compute the fuel cost as the heat rate expressed in MMBTU/MWH with the Cost (e.g. USD/MMBTU) to derive the fuel cost per MWH. • Fuel Cost (USD/MWH) = Heat Rate (MMBTU/MWH) x Fuel Price (USD/MMBTU) • Add the variable O&M per MWH to the fuel cost to derive the total variable cost per MWH. • Variable Cost (USD/MWH) = Fuel Cost + Variable O&M • Add the total fixed cost to the variable cost to derive the levelized cost per MWH. • Levelised Cost/MWH = Total Fixed Cost/MWH + Total Variable Cost/MWH
LCOE Basic Illustration • First Need the Operating Parameters for Solar or for Diesel. Need the variable and fuel costs for diesel.
Now Move to Carrying Charges • Carrying Charges can be computed with the PMT function. You can reconcile this to a simple financial model. Can compute on a nominal or real basis.
LCOE on Nominal or Real Basis • Compute on both a nominal and real basis using alternative carrying charge rates.
Reconciliation of LCOE and Project Finance Model • Proof: Put in real rate with inflation. Then put in the inflation rate for revenues and operating costs. • Demonstrate that the project IRR is achieved.
LCOE for Base Load and Intermittent Plant • Treat the levelized cost analysis differently for a base load plant and an intermittent low capacity factor renewable energy plant. • For the base load plant measure the avoided cost of unavailable time. • For the intermittent plant with low capacity factor (e.g. solar and low capacity factor wind), measure the levelized cost relative to short-run avoided cost (should include the cost of ancillary services). • For the intermittent plant with a high capacity factor (e.g. off-shore wind and geothermal), could perform a loss of load probability analysis that credits the intermittent plant with some capacity value. • Note that the carrying charge formula is consistent with the formula: • LCOE = NPV(Revenues)/NPV(MWH) when degradation is accounted for in the carrying charges and the carrying charge formula includes inflation. This implies that the carrying charges are computed on a real and not nominal basis if all the fuel and O&M components are inflated on the same basis.
Use of LCOE for Comparison with Dispatchable Technologies • Compare Real LCOE (not nominal) to Current Variable Costs including Fuel and Variable O&M. Can make adjustment for spinning reserve also.
Revenue Build-up and LCOE • LCOE is the levelized or weighted average price of electricity over the lifetime of a project • Cost of electricity is Revenue/MWH • LCOE is weighted Revenue/MWH over the lifetime of a plant • Weighting • Cost of capital so future revenues have lower weight than current revenues • Amount of generation so periods with more generation have more weight • Instead of detailed weighted average could use NPV formula where • LCOE = NPV of Revenues/NPV of Generation
Risk Allocation and Drivers in PPA Agreement • Plant Cost and Construction Delay • Efficiency (Heat Rate) • Fuel Price • Capacity Factor and Availability Factor from Forced and Unforced • Variable O&M Expense • Fixed O&M Expense • Carrying Charge Rate • IPP Controls and Takes Risk • IPP Control and Risk • Off-taker Risk • Off-taker Controls Dispatch, IPP controls Availability • IPP Control and Takes Risk • IPP Control and Risk • Off-taker
Drivers and Contracts - Renewable • IPP Risks • Cost of Project, Time Delay and Technology Parameters • Capacity Factor Risk • O&M Risk • Interest Rate Fluctuation • Risk Mitigation • EPC Contract with Fixed Price and LD (LSTK) • NONE !!! • O&M Contract • Interest Rate Contract (Fix Rates)
Example of LCOE • Prices • Price in Year 1 is 100 • Price in Year 2 is 200 • Generation • Generation is 500 in year 1 • Generation is 1000 in year 2 • Discount Rate is 10% • PV Factor is 1/1.1 = .909 in year 1 • PV Factor is 1/1.21 = .826 in year 2 • Average price is 150 • Weighted average price for Generation is: 33 x 100 + .67 x 200 = 33 + 134 = 167. This can be computed as (100 x 500+200 x 100)/1,500 or 167. This is sum of revenue/sum of generation • Weighted average price for discounting is .909 x 100 + .826 x 200 divided by (.909 + .826) • LCOE Combines weightings
LCOE Illustration • LCOE formula: • LCOE = NPV Revenues/NPV Units
LCOE Benchmarking • Ask Questions about cost, O&M, heat rate etc. in Biomass
LCOE Benchmarking 3 • Which one should you believe – look at the Capital Cost of biomass
Base Case LCOE from Database • Solar LCOE with Different Carrying Charge Rates from Database
LCOE Best Case • Low real returns, high debt, low credit spreads
LCOE Worst Case • High real returns, low debt, high credit spread. Note how costs are double.
Solar Power Yield Files • Case study on comparison of yield from alternative sources. • Problem is that there is more variation from different sources than comes from the year by year variation. • Location of files on edbodmer.com
Output from EU file on Point of Access and Output to Grid • The yield analysis demonstrates that different sources can give you different results and this comes from either the point of access energy or the performance ratio.
Solar Power Yield – Database of Actual Production • Note the small actual variation in solar production – the problem is the starting point and risk goes down after COD.
Year by Year Variation • Compute the P90 level from standard deviation and average using NORMINV
P90 and P50 DSCR with Actual Case • Actual case where P50 and P90 were estimated.
Use of Regression to Find the Implied Temperature on the Panels • Objective: Come up with a reasonable method where you can use the temperature reported in the EU website and derive a reasonable production estimate. • At the end of the section you can do the following with the EU data: • Compute the Panel Temperature from the Ambient Temperature • For example, Panel = 20 + 1.2 * Ambient • Apply the temperature coefficient to the panel temperature • Use a typical loss factor for other items • Therefore, derive a performance ratio that is a function of the temperature
Formulas • The energy from a solar project can expressed as capacity factor or yield. The energy hitting the solar plane (point of access) can be expressed as a capacity factor – watt hour on average over the year divided by 1000. • The energy produced can also be expressed as a capacity factor: • Capacity Factor = (Energy/8760)/Capacity
Solar PV – Inverter and Solar Arrays Capacity Factor of Generation to Grid relative to kWp Capacity Factor of Sunlight – Average Sunlight Divided by Capacity of Sunlight Defined as 1000 w Performance Ratio is the Capacity Factor of the Final Divided by the Capacity Factor of Amounts that Hit the Array
Work Through PVSyst Can divide the energy injected to grid divided by radiation on collectors • Don’t need anything other than the column of Effective Irradiance on Collectors as well as Energy Injected into the Grid. Convert both of these to capacity factors and then divide the energy into grid by the irradiation on collectors.


