Standard Scores
Standard Scores. Comparing scores across (normal) distributions – “z-scores”. 1. Assessing the relative position of a single score. Move from describing a distribution to looking at how a single score fits into the group Raw Score: a single individual value i.e. 36 in exam scores

Standard Scores
E N D
Presentation Transcript
Standard Scores Comparing scores across (normal) distributions – “z-scores” 1
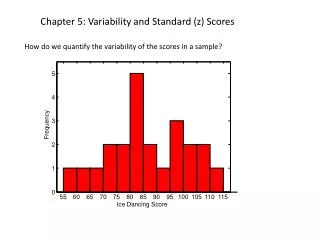
Assessing the relative position of a single score • Move from describing a distribution to looking at how a single score fits into the group • Raw Score: a single individual value • i.e. 36 in exam scores • How do we interpret this value – how good is it? 1
Describe the “typical” and the “spread”, and the number of cases Minimal Statistics • Mean • SD • N • Z-SCORE: identifies a score as above or below the mean AND expresses a score in units of SD • E.g. • z-score = 1.00 (1 SD above mean) • z-score = -2.00 (2 SD below mean) 1
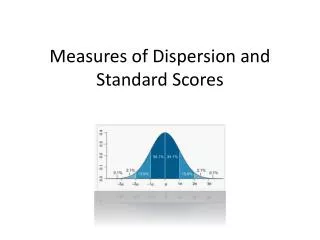
Z-score = 1.0: GRAPHICALLY 84% of scores smaller than this Z = 1 1
Calculating z-scores 1 2 Calculate Z for each of the following situations: 4 3 5
Other features of z-scores • Mean of distribution of z-scores = 0 (i.e. 0 = 0 SD) • SD of distribution of z-scores = 1 • since SD is unit of measurement • z-score distribution is same shape as raw score distribution 1 2 3
Z-scores can compare scores from different distributions • Mary’s score • SAT Exam 550 (mean 500 SD 100) • Gerald’s score • ACT Exam 24 (mean 18 SD 6) • Who scored higher? 1 2 Mary: (550 – 500)/100 = ? 3 4 Gerald: (24 – 18)/6 = ?
Z-scores & the normal curve • For any z-score, we can calculate the percentage of scores between it and the mean; all scores below it & all above it • Applet demos: • http://psych.colorado.edu/~mcclella/java/normal/normz.html • http://psych.colorado.edu/~mcclella/java/normal/handleNormal.html • http://psych.colorado.edu/~mcclella/java/normal/tableNormal.html 1 2 3 4 5
Finding z-scores in PASW Choose this option…
Finding z-scores in PASW Slide the variable over that you want converted to z-scores And choose this
Finding z-scores in PASW 1 The z-scores pop up in the data window as a new variable
Finding z-scores in Excel 1 First compute the average for the variable
Finding z-scores in Excel 1 Then the SD
Finding z-scores in Excel 1 Then stick in the relevant formula in the first cell (note use of $)
Finding z-scores in Excel Then just copy down 1 2