Download
1 / 32
320 likes | 337 Vues
This lecture covers the global energy balance, the greenhouse effect, radiative energy balance, albedo, the greenhouse effect, and the consequences of global warming. It also discusses the El Nino Southern Oscillation and its mechanisms.

E N D
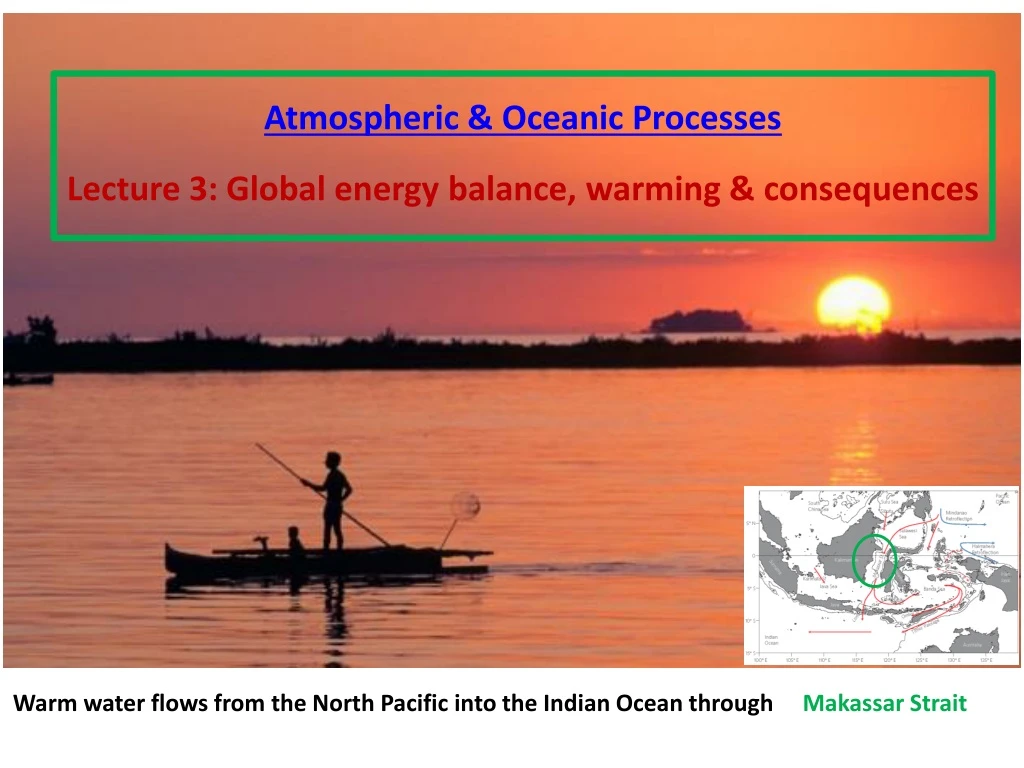
Atmospheric & Oceanic ProcessesLecture 3: Global energy balance, warming & consequences Atmospheric & Oceanic ProcessesLecture 3: Global energy balance, warming & consequences Warm water flows from the North Pacific into the Indian Ocean through Makassar Strait
Greenhouse Gases Greenhouse gases: carbon dioxide, methane, nitrous oxide, water vapor, etc. Function: they absorb and emit heat energy, creating the greenhouse effect that keeps our planet's temperature livable Water vapor is the most plentiful greenhouse gas on the planet, accounting for about 60% of the current greenhouse effect. Since the industrial revolution, people have burned vast amounts of coal, petroleum, and other fossil fuels to create heat and power. This releases carbon dioxide, the most plentiful human-produced greenhouse gas, into the atmosphere. The result: more heat is trapped in Earth's atmosphere instead of radiating out into space.
Radiative energy balance Earth's surface temperature has been quite stable over time, 3 oCover 1000’s of years; Temperature is stable because earth radiates energy back to space at a rate energy input it receives from the sun -- the planet is close to being in radiative energy balance; Sun emits radiation strongly in the visible light range of the electromagnetic spectrum; it also produces ultraviolet and infrared radiation. The earth radiates heat back to space mostly at much longer wavelengths than solar radiation (see Figure below): 4m Figure:The electromagnetic spectrum. The Sun is much hotter than Earth, so it emits radiation at shorter wavelengths. The solar spectrum x 10-6 applies at the surface of the Sun, not at Earth's orbit. Solar energy flux is lower by a factor of 50,000 at Earth's orbit.
Albedo Solar radiation is absorbed by clouds, the atmosphere, or the earth’s surface, and then is transformed into heat energy, which raises Earth's surface temperature. But some fraction is reflected back to space: albedo = (reflected radiation)/(incident radiation) (=0 black, 1 white), usually referring to some appropriate average across the spectrum of visible light. Figure: The albedo of various surface conditions of the earth
Albedos for different surfaces. Note that the albedo of clouds is highly variable and depends on the type and form.
The albedo of the Earth’s surface. Over the ocean the albedo is small (2–10%). It is larger over the land (typically 35–45% over desert regions) and is particularly high over snow and ice (∼80%).
The Solar Constant & Earth’s Temperature without Greenhouse gases Sun’s energy flux onto earth = the Solar Constant = S 1.38 kW m-2 i.e. 1-m-diameter dish can collect enough solar energy to power 1-kW electric heater. Total energy received by earth = R2S Averaged per unit area of earth’s surface = R2S/4R2 = S/4 345 W m-2(= I, say) So earth’s temperature T = (345/B )1/4 = (345/5.6704×10-8 )1/4 270 K 0 oC. But earth is warmer than this. R
A simple model of the Greenhouse effect Radiative heat balances in “1” & “2” I = (1-e) U + B B = I – (1-e) U I = U – B B = U - I Eliminating B, then, U = I/(1-e/2) Also: T = (U/B)1/4 If e = 1 (maximum), then T is warmer than the 270K found with e = 0 by a factor = (2)1/4 1.19; so that Tmax 321K 48 oC Too warm, much too warm! Long waves >4m “1” “2” I (<4m) (1-e) U = 345 W m-2 B Glass e = fraction of heat absorbed B I U Ground The Plank constant is: B = 5.6704×10⁻⁸ J/(s.m2);
Temperatures in the past 2000 years Reconstructed Temperature Using Climate Proxies: ice cores, tree rings, sub-fossil pollen, boreholes, corals, and lake and ocean sediments Instrumental record 1565
How much has the global temperature risen in the last 100 years? El Nino 2015 warming hiatus? 1910-1945 1946-1975 1976-2000 2000-.. Averaged over land and ocean surfaces, temperatures warmed~0.85ºC from 1880 to 2015 (Intergovernmental Panel on Climate Change; IPCC). Oceans tend to warm and cool more slowly; continents have warmed the most. In the Northern Hemisphere, the 3 decades from 1983 to 2015 were likely the warmest ~30Year period of the last 1400 years.
El Nino Southern Oscillation (ENSO) Mechanisms • Trade wind – from east to west • Thermocline – becomes shallower in the eastern Pacific; deeper in the west • Equatorial upwelling - forms cold tongue • Atmospheric pressure gradient strengthens– the Walker Circulation intensifies, and reinforces the trade wind Oceanic PGF : Direction: west to east Atmospheric PGF = Direction: east to west
Trade wind weakens -because of episodic westerly wind bursts • Warm water shifts to the middle of the Pacific & equatorial Kelvin waves are excited (propagating eastward) • Thermocline is depressed on the east side of the Pacific • Warm SST anomalies in the eastern Pacific- cause further weakening of the trade winds & the surface warming
After El Niño, there will be some delayed negative feedbacks, returning the system to normal condition or sometimes to overshoot into a La Niña phase.
El Nino & La Nina Schematic view of sea surface temperature and tropical rainfall in the equatorial Pacific Ocean during normal, El Niño, and La Niña conditions.The sea-surface temperature is shaded: blue-cold and orange-warm. The dark arrows indicate the direction of air movement in the atmosphere: upward arrows are associated with clouds and rainfall and downward-pointing arrows are associated with a general lack of rainfall.
Onset of El Nino • Normal condition • Trigger of El Nino: • Air-Sea Coupling • Wind weakens • Warm water moves east • Wind weakens further … • Warm water moves further east • etc… Walker Circulation C W W W
ONI ONI is the running 3-month mean SST anomaly for the Niño 3.4 region (i.e., 5oN-5oS, 120o-170oW)
El Nino La Niña
Looking at the plot below (also slide12), the rise in global SST appeared to have “paused” (i.e. warming hiatus) beginning in year ~2000 ... warming hiatus? Scientists have been baffled by the warming hiatus; there are various hypotheses of why …
1. Natural variability? Since 2000, there has been a dominance of La Nina over El Nino cool temperature over the eastern equatorial Pacific. El Nino La Niña
3. Aerosol: fires, volcanoes, pollution…? Prime minister's office shrouded in haze in Putrajaya, Malaysia, Friday, Sept. 11, 2015. Haze over Sumatra and Borneo, Indonesia, Sep/2015.
4. Is heat hiding in the deeper layers of the ocean? Since 2006, we have near-global measurements of the ocean’s subsurface temperatures up to 2000 m deep using the ARGO Floats
4. Is heat hiding in the deeper layers of the ocean, and in the southern ocean? Trend of Ocean heat content Temperature anomaly
Global ocean overturning circulation(link) Global ocean overturning circulation (or thermohaline circulation) pattern known also as the ‘conveyer belt’. It is a schematic representation of a highly complex, turbulent flow. Blue represents deep flow (2–4 km, red shallow flow (< 2 km).
5. Changes in circulation patterns in the Atlantic and Southern oceans? • Overturning circulation carries sun-warmed tropical waters into the higher latitudes, where they sink and flow back towards the Equator • From 1970s~1990s, circulation is slow, allowing warm water to linger longer at the surface – contributing to global warming • After 1990s~.., flow speeds up, plunging the warmer water into ocean depths before it has lost much heat to the air, making the subsurface ocean warmer… 1970s~1990s 1990s~.. 70o 70o 0o 0o
5. Changes in circulation patterns in the Atlantic and Southern oceans?
Homework #3 All HWs are due in 2 weeks from the time they are distributed. Download ARGO data from 2006 to 2015. The plot yearly-mean Ocean Heat Content (OHC) over the entire globe from surface to -1000 m below the surface. Plot the time series. Explain why the North Pacific Ocean’s salinity is different from that of the North Atlantic. Read this: Wijffels-etal-OceanMeasuresEarthWarming-NatClimChange2016.pdf; then write a 1-2page summary to tell what you think? The trade wind along the equator is Uw = -10 m/s. If kinematic wind stress xo = 10-3×Uw2/w, where w = sea-water density 103 kg m-3. If the wind stress balances pressure gradient due to sea level, then how much is the sea surface raised in the western Pacific compared to the eastern Pacific assuming that the width of the Pacific Ocean is 20,000 km? Google to find out what the observed sea-level difference is, and compare that with your answer in “4”. Bonus HW: Climate sensitivity = Ts/Q, i.e. the change of the earth’s surface temperature Ts due to change in energy input Q. Suppose the earth warms, show (hint: use the Stefan-Boltzmann Law of black-body radiation Q = BTs4) that for every Q = 1 W m-2, Ts ¼ oC. Bonus HW: Show using the Clausius-Clapeyron relation that for every 1 oC warming of the atmosphere, the % increase in the saturated water vapor pressure es/es is 7%. Bonus HW – see next slide.
Homework #3 “1” “2” “3” BONUS HW 3.6 Consider 2 absorption layers in the atmosphere – as shown on left: Formulate the radiative balance equation in each layer; then (2) Solve and calculate the surface temperature Ts using e1 = 0.4 and e2 = 0.2 I (<4m) ??? (1-e2) U = 345 W m-2 I I U B1 B2 e2 (absorption by CO2 & H2O) e1 (absorption by Ozone) B1 B2 Ground
Homework #3 “1” “2” “3” (1-e1)(1-e2)U BONUS HW 3.6 – Solution: I = (1-e1)(1-e2)U + B1 (1) I = (1-e2)U + B2 - B1 (2) I = U – B2 (3) (1)+(2) to eliminate B1, then use (3) to substitute for B2 to get U in terms I: σT4 = U = I/[1-(2e2+e1–e1e2)/3]; So, using the given numerical values: T4 = (454/σ)1/4 T = 299K or ~26oC I (<4m) (1-e2) U = 345 W m-2 I I U B1 B2 e2 (absorption by CO2 & H2O) e1 (absorption by Ozone) B1 B2 Ground


