A Flexible Statistical Control Chart for Dispersed Count Data
260 likes | 447 Vues
This presentation by Dr. Kimberly F. Sellers discusses advanced statistical methodologies for analyzing count data using flexible control charts. Key topics include the Poisson distribution, its limitations, alternative distributions like Negative Binomial, Generalized Poisson, and Conway-Maxwell-Poisson (COM-Poisson). Various applications in fields such as marketing, biology, and transportation are explored, demonstrating how these distributions impact control chart theory and practice. The importance of understanding dispersion in data to avoid false detections in control charts is emphasized.

A Flexible Statistical Control Chart for Dispersed Count Data
E N D
Presentation Transcript
A Flexible Statistical Control Chart for Dispersed Count Data Kimberly F. Sellers, Ph.D. Department of Mathematics and Statistics Georgetown University
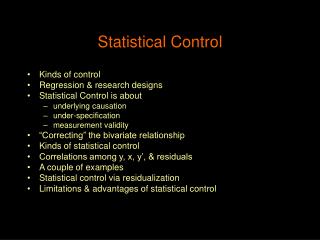
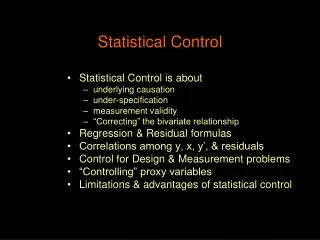
Presentation Outline • Background distributions and properties • Poisson distribution • Alternative distributions • Conway-Maxwell-Poisson distribution • Control chart for count data • Examples • Discussion
The Poisson Distribution • Poisson(), has probability function
Motivation: Poisson Distribution • , i.e. • Implies equidispersion assumption • Assumption oftentimes does not hold with real data • Implications affect numerous applications involving count data!
Alternative I: Negative Binomial Distribution • pmf for rvY ~ NB(r,p): • Mixing Poisson(l) with gammaNegBin marginal distribution • Popular choice for modeling overdispersion in various statistical methods • Well studied with statistical computational ability in many softwares (e.g. SAS, R, etc.) • Handles overdispersion (only!)
Alternative II: Generalized Poisson Distribution(Consul and Jain, 1973; Consul, 1989) • has the form and 0 otherwise, where, = largest positive integer s.t. when • = 0 : Poisson() distribution • > 0 : over-dispersion • < 0 : under-dispersion
Alternative II: Generalized Poisson Distribution • Generalized model developments: • Regression model (Famoye, 1993; Famoye and Wang, 2004) • Control charts (Famoye, 2007) • Model for misreporting (Neubauer and Djuras, 2008; Pararai et al., 2010) • Disadvantage: • Unable to capture some levels of dispersion • Distribution truncated under certain conditions with dispersion parameter not a true probability model Introducing the Conway-Maxwell-Poisson (COM-Poisson) distribution
The COM-Poisson Distribution(Conway and Maxwell, 1961; Shmueli et al., 2005) • pmf for rvY ~ COM-Poisson(): where • Special cases: • Poisson (n = 1) • geometric (n = 0, l < 1) • Bernoulli
COM-Poisson Distribution Properties • Moment generating function: • Moments: • Expected value and variance: where approximation holds for n < 1 or l > 10n
COM-Poisson Distribution Properties • Has exponential family form • Ratio between probabilities of consecutive values is
COM-Poisson Distribution Properties • Simulation studies demonstrate COM-Poisson flexibility • Table II assesses goodness of fit on simulated data of size 500
COM-Poisson Probabilistic and Statistical Implications • Distribution theory (Shmueli et al., 2005; Sellers, 2012) • Regression analysis (Lord et al., 2008; Sellers and Shmueli, 2010 including COMPoissonReg package in R; Sellers and Shmueli, 2011) • Multivariate data analysis (Sellers and Balakrishnan, 2012) • Control chart theory (Sellers, 2011) • Risk analysis (Guikema and Coffelt, 2008)
COM-Poisson Applications • Linguistics: fitting word lengths (Wimmer et al., 1994) • Marketing and eCommerce: modeling online sales (Boatwright et al., 2003; Borle et al., 2006); modeling customer behavior (Borle et al., 2007) • Transportation: modeling number of accidents (Lord et al., 2008) • Biology: Ridout et al. (2004) • Disclosure limitation: Kadane et al. (2006)
How do these distributions impact control chart theory development? • Shewhartc- and u-charts’ equi-dispersion assumption limiting • Over-dispersed data false out-of-control detections when using Poisson limit bounds • Negative binomial chart: Sheafferand Leavenworth (1976) • Geometric control chart: Kaminsky et al. (1992) • Under-dispersion: Poisson limit bounds too broad, potential false negatives; out-of-control states may (for example) require a longer study period to be detected. • Generalized Poisson control chart: Famoye (2007)
How do these distributions impact control chart theory development? (cont.) • Conway-Maxwell-Poisson (COM-Poisson) control charts accommodate over- or under-dispersion • Generalizes c- and u-charts (derived by Poisson distribution), as well as np- and p-charts (Bernoulli), and g- and h-charts (geometric)
COM-Poisson Control Charts(Sellers, 2011) • Control chart development uses shifted COM-Poisson distribution • Computations and point estimation determined using compoisson and COMPoissonReg in R
To c or not to c? (chart, that is) Moral: Use historical in-control data to determine the control limits!
Discussion • Flexible method encompassing classical control charts • Amount of dispersion influences bound size • Limits shown here based on 3s rule • Saghiret al. (2012) took my advice! They consider probability limits of the following form and study its impact : • R package in progress
Discussion: Required limit • Table II from Saghir et al. (2012) shows how changes with increased sample size (), and increased and • decreases with increased , , or sample size ()
Selected References • Consul PC (1989) Generalized Poisson Distributions: Properties and Applications, Marcel Dekker Inc. • Conway RW, Maxwell WL (1961) A queueing model with state dependent service rate, The Journal of Industrial Engineering, 12(2):132-136. • Famoye F (1994) Statistical control charts for shifted Generalized Poisson distribution. Journal of the Italian Statistical Society, 3:339-354. • Kaminsky FC, Benneyan JC, Davis RD, Burke RJ (1992). Statistical control charts based on a geometric distribution. Journal of Quality Technology, 24(2):63-69. • Saghir A, Lin Z, Abbasi SA, Ahmad S (2012) The Use of Probability Limits of COM-Poisson Charts and their Applications, Quality and Reliability Engineering International, doi: 10.1002/qre.1426 • Sellers KF (2011) A generalized statistical control chart for over- or under-dispersed data, Quality Reliability Engineering International, 28 (1), 59-65. • Shmueli G, Minka TP, Kadane JB, Borle S, Boatwright P (2005). A useful distribution for fitting discrete data: revival of the Conway-Maxwell-Poisson distribution. Applied Statistics, 54:127-142.